Reports Page
In the Reports section, you are able to pull various reports to help you understand how your locations are performing with Opiniion and what results have been generated. You can “Star” your favorite reports to quickly find them again, or use our Scheduler which makes it easy to set up recurring reports for distribution on an automated basis. See below for a full list of reports and detailed insights on what you can learn from each of them. To learn more about exporting and scheduling reports - see here.
List of Reports
Current vs. Previous
Employee Response
Engagement By Survey
Engagement By Standard Events
Feedback By Campaign
Feedback By Standard Events
Likelihood to Refer
Location Overview
Negative Feedback Captured by Year
Resident Satisfaction
Response Rate - Feedback
Reviews by Source
Staff Performance
Standard Events Over Time
Trending Reviews by Rating
Trending Reviews by Volume
Word Analysis
Current vs. Previous
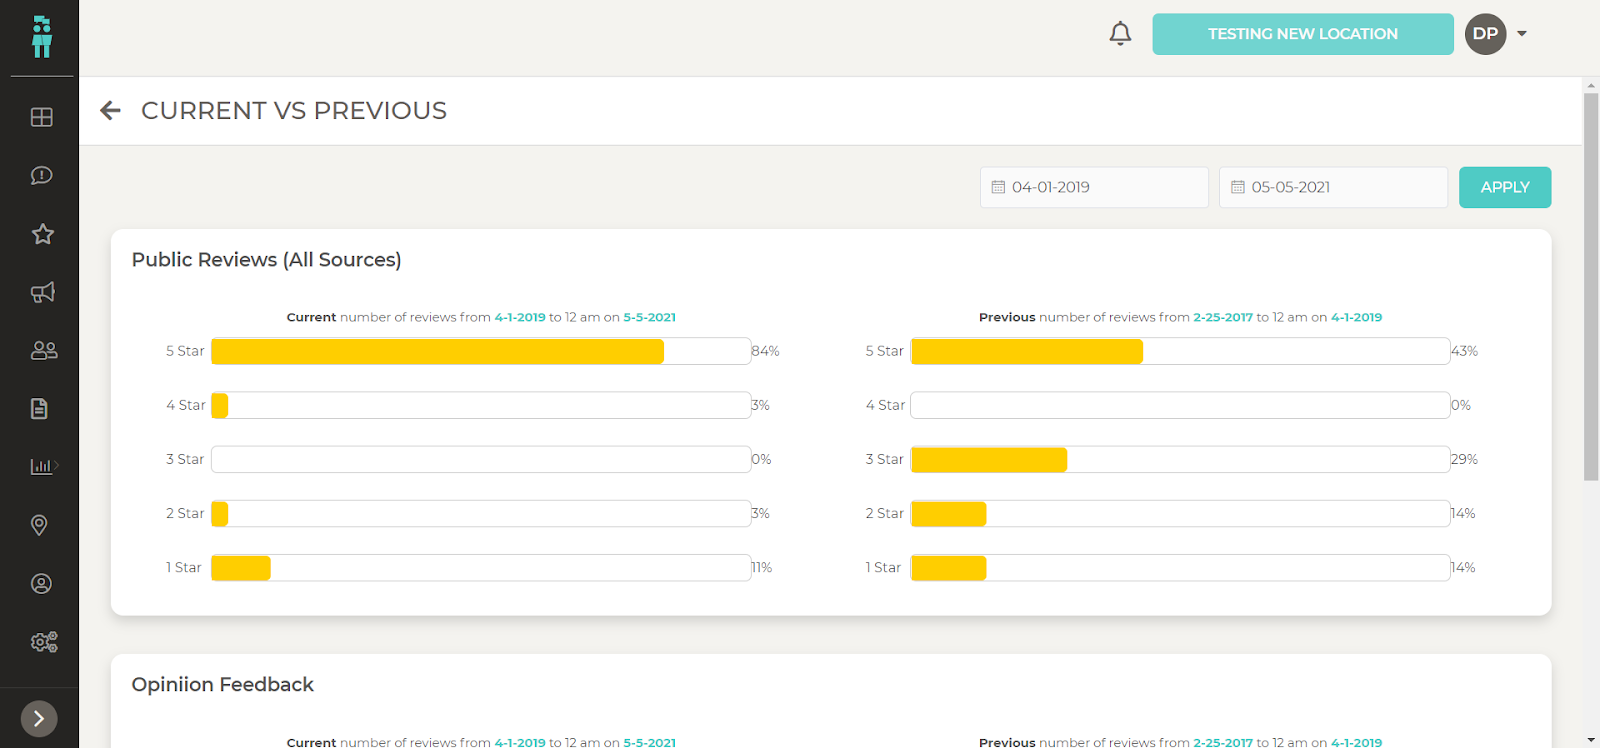
This report shows the 1-5 distribution for both public and private ratings in a selected time frame.
This can be used to see how a location(s) is doing currently vs a previous period.
For example a user can select to see how they did in the most recent month vs the previous month before.
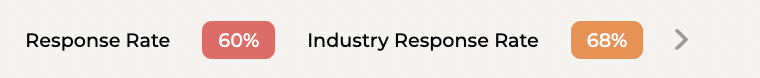
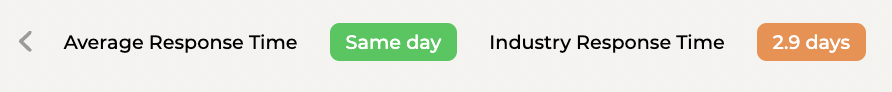
Employee Response
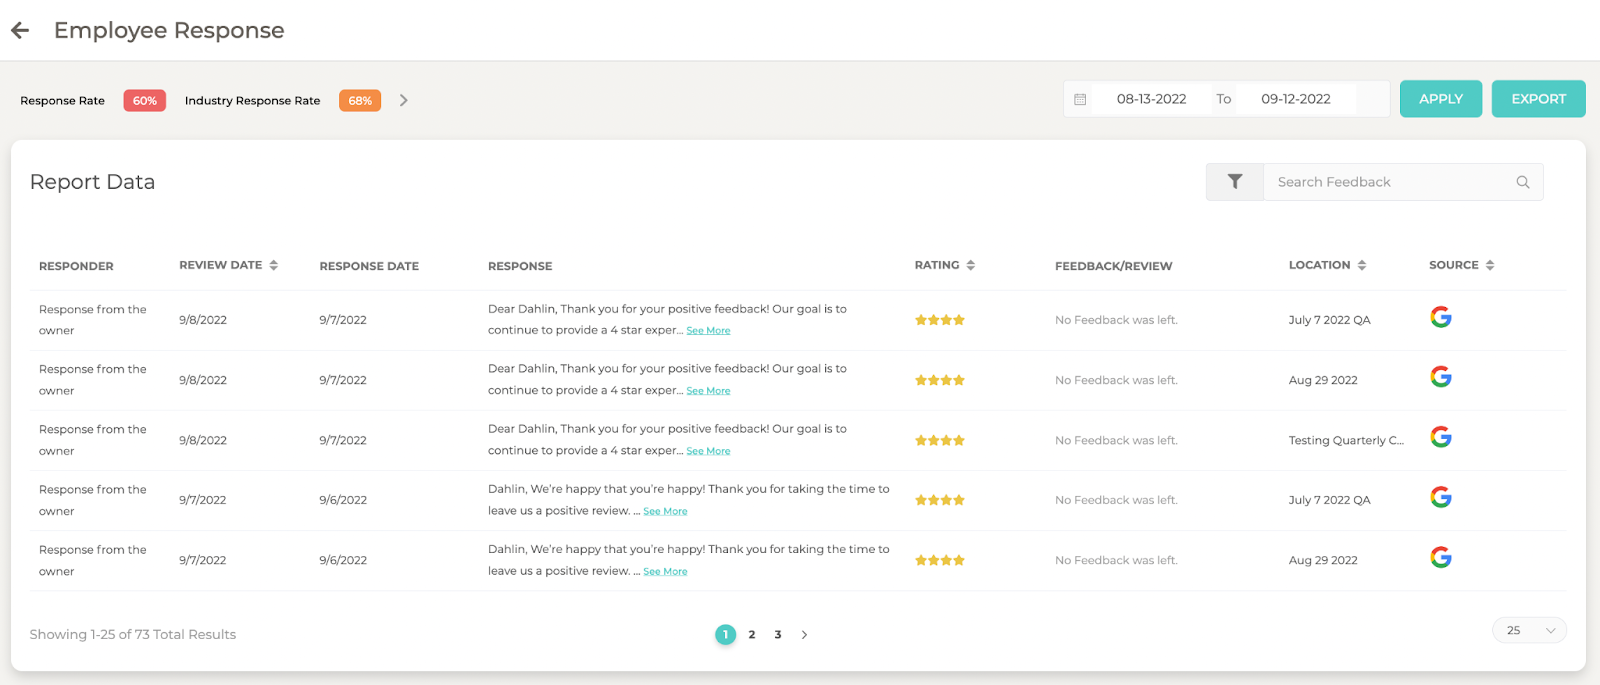
This report provides users with data surrounding the percentage and rate at which reviews and feedback are getting responded to by staff within the selected date period (report will default to the last 30 days).
Industry averages will also be provided for both the Average Response Time and Response Rate.
This report can be exported.
Engagement By Survey
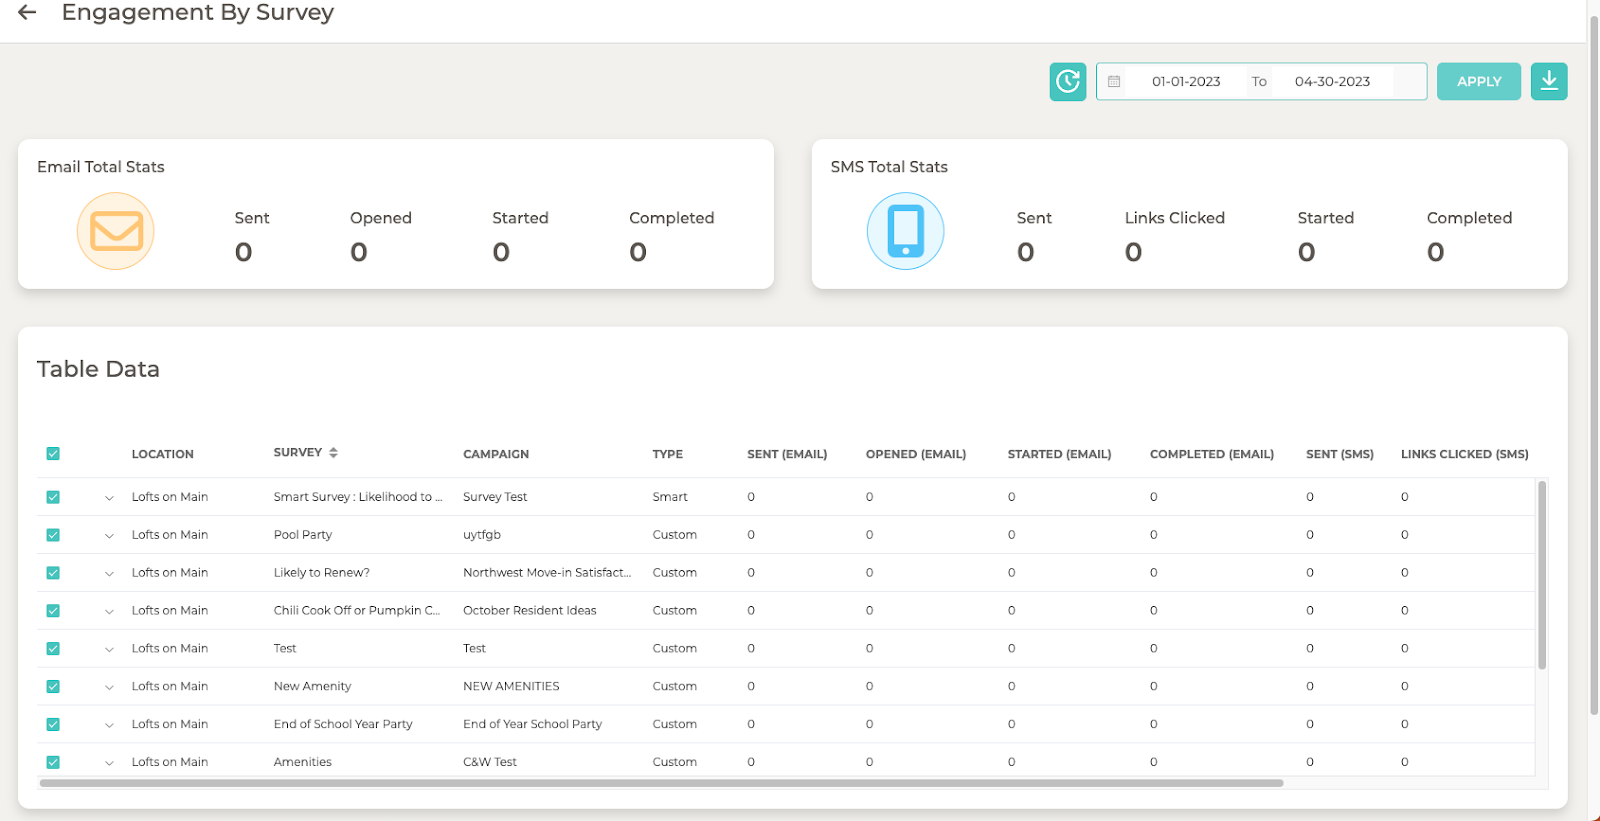
Users can see how many surveys have been sent by email and SMS
Data is separated by survey and it shows you how many surveys have been sent, opened, started, and complete
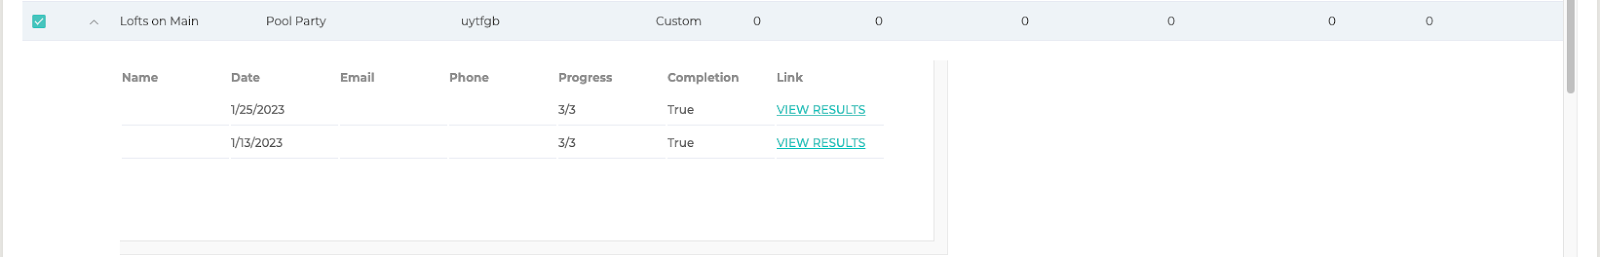
If you click on a survey it will give you a little deeper dive into:
Who has started the survey
How many are in progress
If that individual has completed the survey
You can choose the date range you are looking for
You can also export the data as well
Engagement By Standard Events
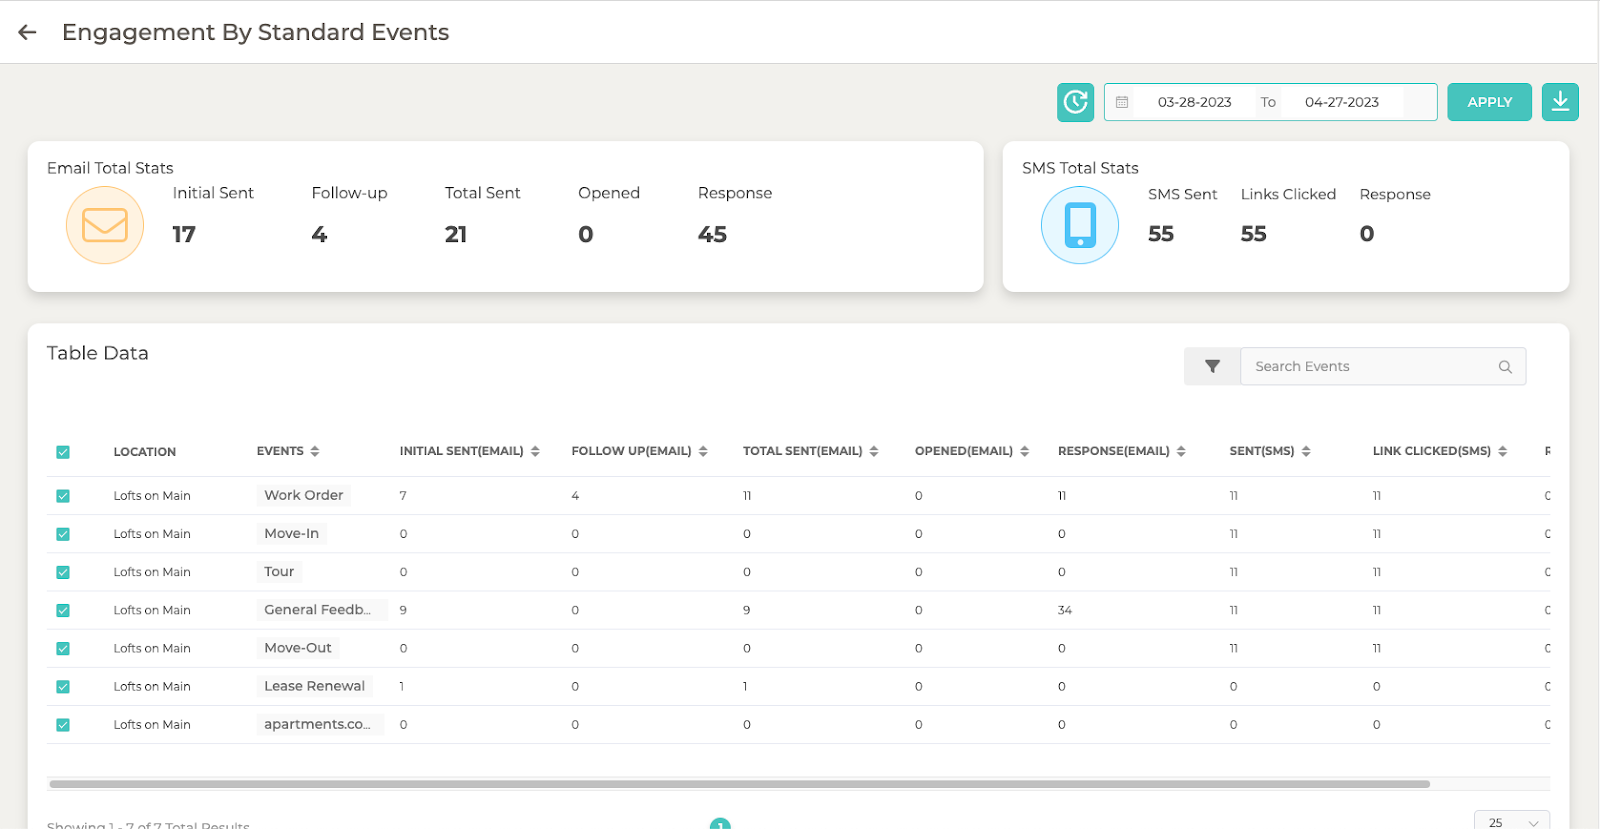
Users can see how many emails and SMS messages are being sent to their customers or residents.
This allows them to see the conversion, how many turned into responses. Response means the customer/resident clicked a 1-5.
This report can be filtered by date and location, and can be exported or scheduled to send automatically.
Please note we do report every single time a customer/resident opens an email.
Feedback By Campaign
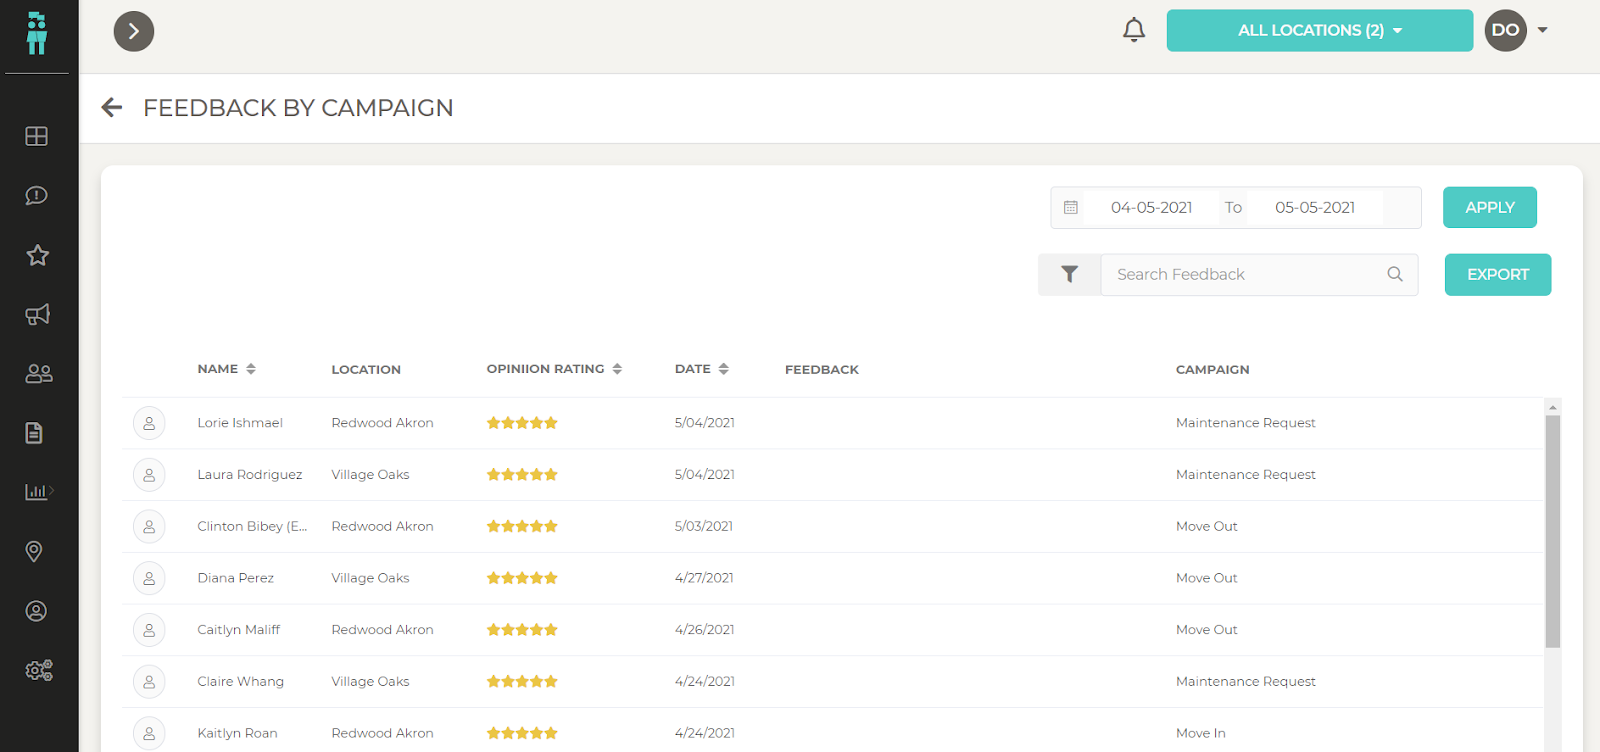
If a user would like to see what type of feedback is being generated by a specific campaign, they can do that here.
This is valuable because, for example, if a property manager wants to see what type of feedback their move-outs are leaving, they can quickly see what they need to improve.
This report also gives the user the ability to select a time frame, and all data is exportable.
Feedback By Standard Events
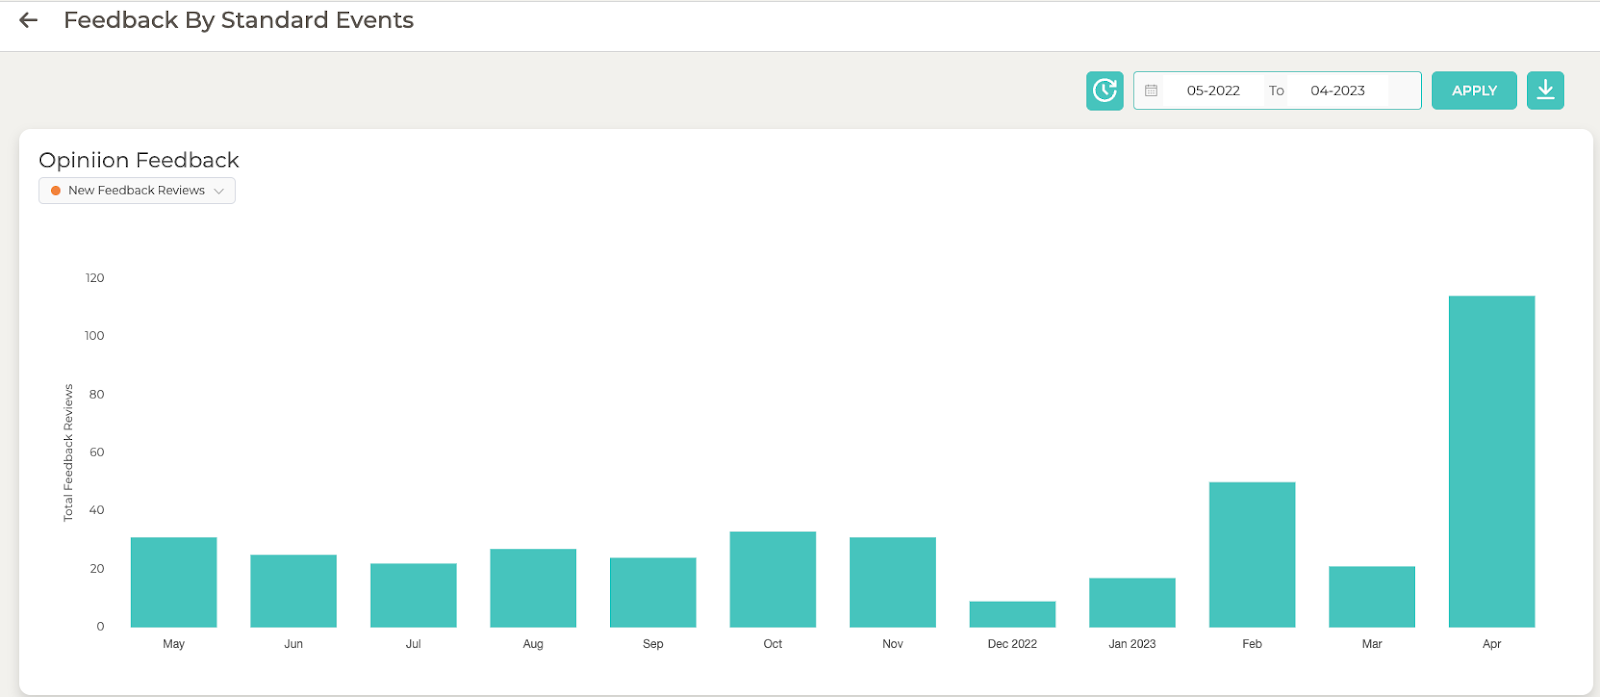
This report shows how customers/residents clicked a 1-5 each month.
By default it will show the past 12 months, but a user will have the option to adjust the time range by month.
The bar charts make it easy to compare how many new ratings a location(s) got compared to a different month.
The default view will be the “New Feedback Reviews” which will focus on displaying the trend of new feedback reviews.
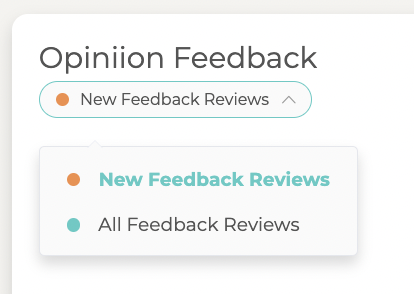
A user can change the view of the graph to “All Feedback Reviews” by selecting it from the dropdown menu in the top left corner. This view will display the trend of total feedback reviews over selected date ranges.
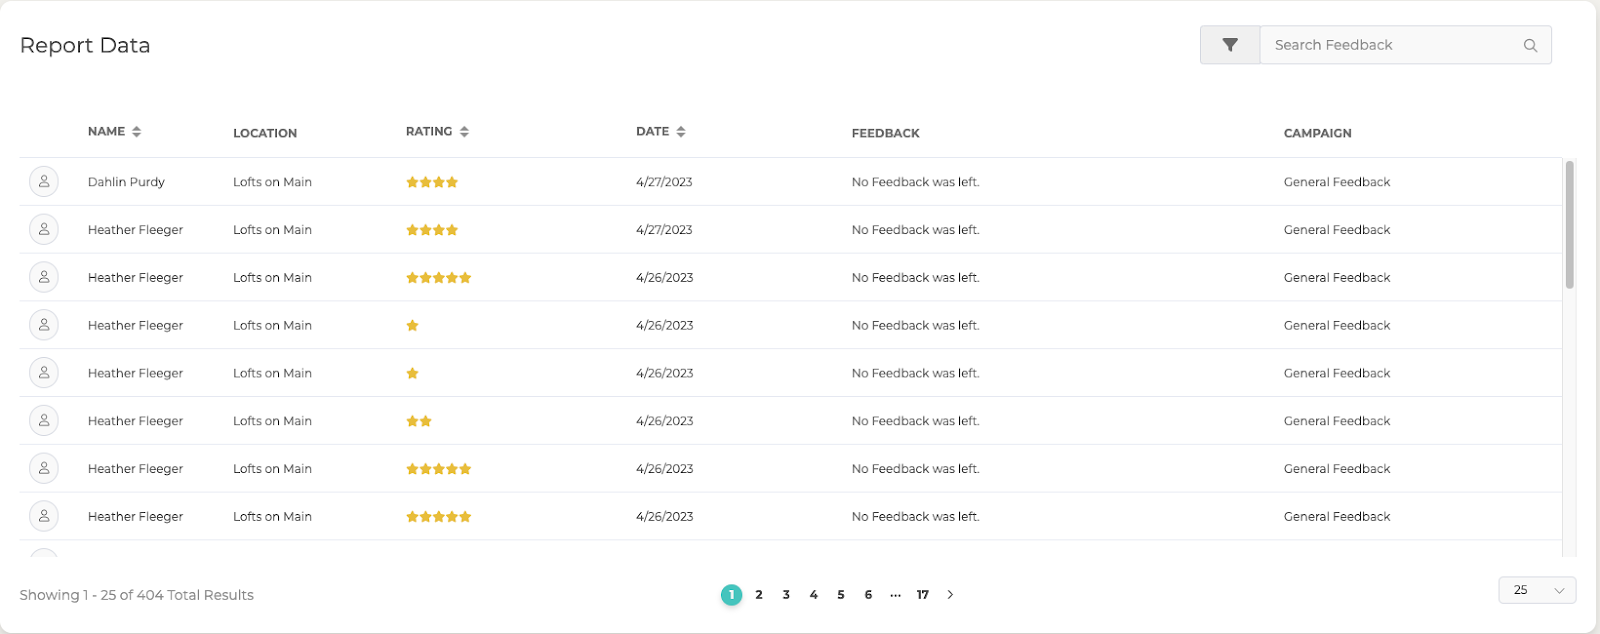
Likelihood to Refer
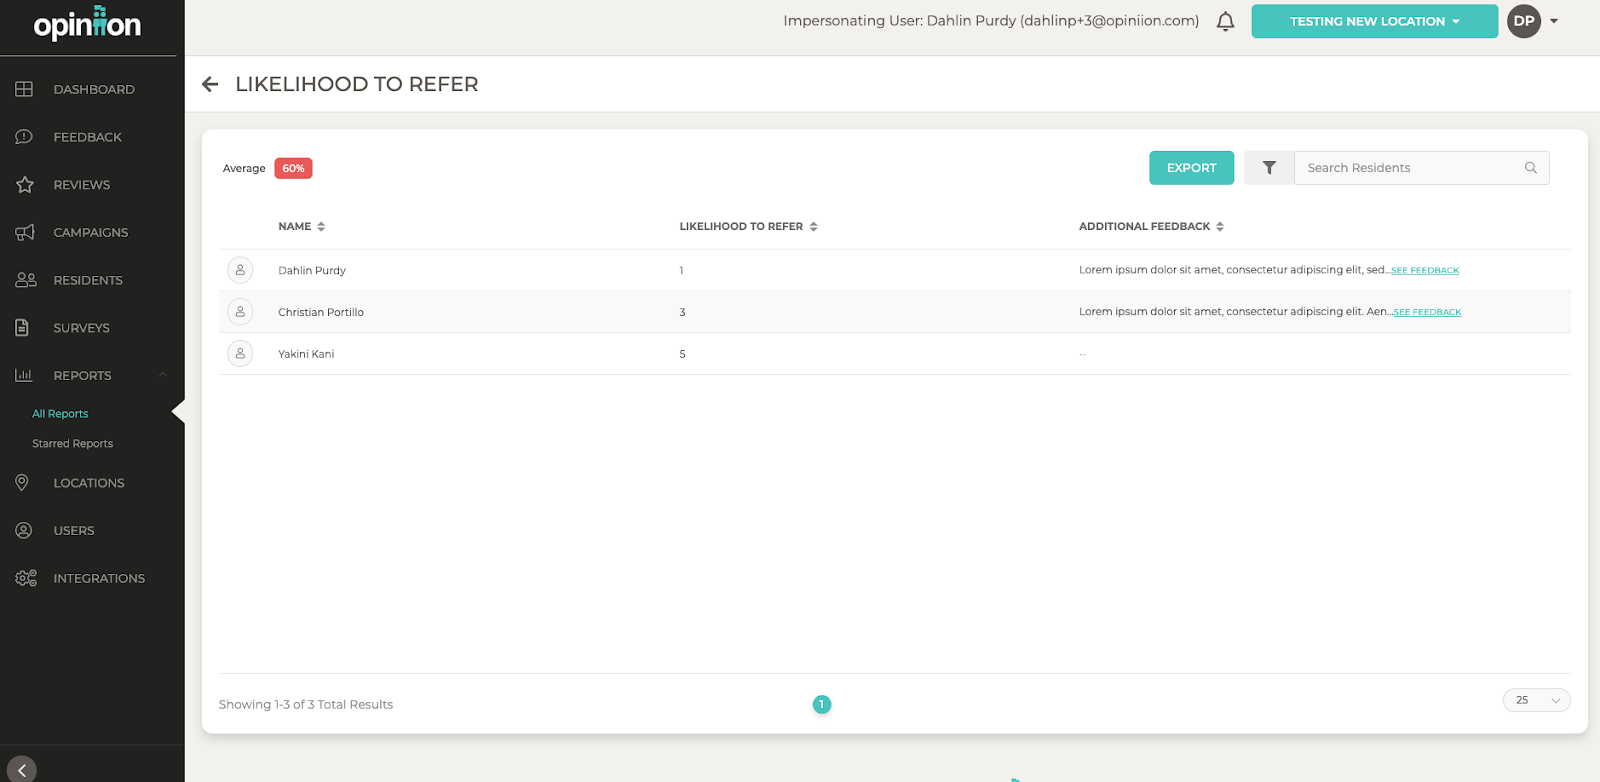
The Likelihood to Refer report lists every Resident that has responded to this survey.
There is one column that displays the rating they left and an Additional Feedback column for any comments submitted.
Users can filter by rating or by those who did or did not leave feedback.
An average rating will display in the top left.
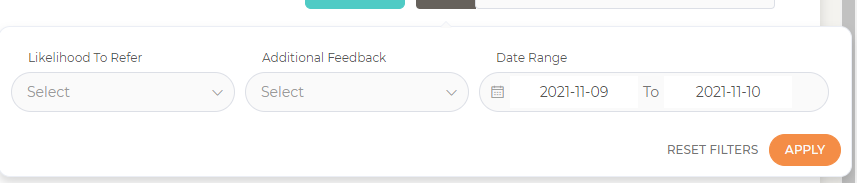
The filters menu includes an option to select a 1-5, as well as filtering by who left additional feedback.
The date range picker is also located in this menu.
The data on the table will filter once a user clicks the Apply button, and all filters will clear including the date range when clicking Reset Filters.
By default no filters are applied
Location Overview
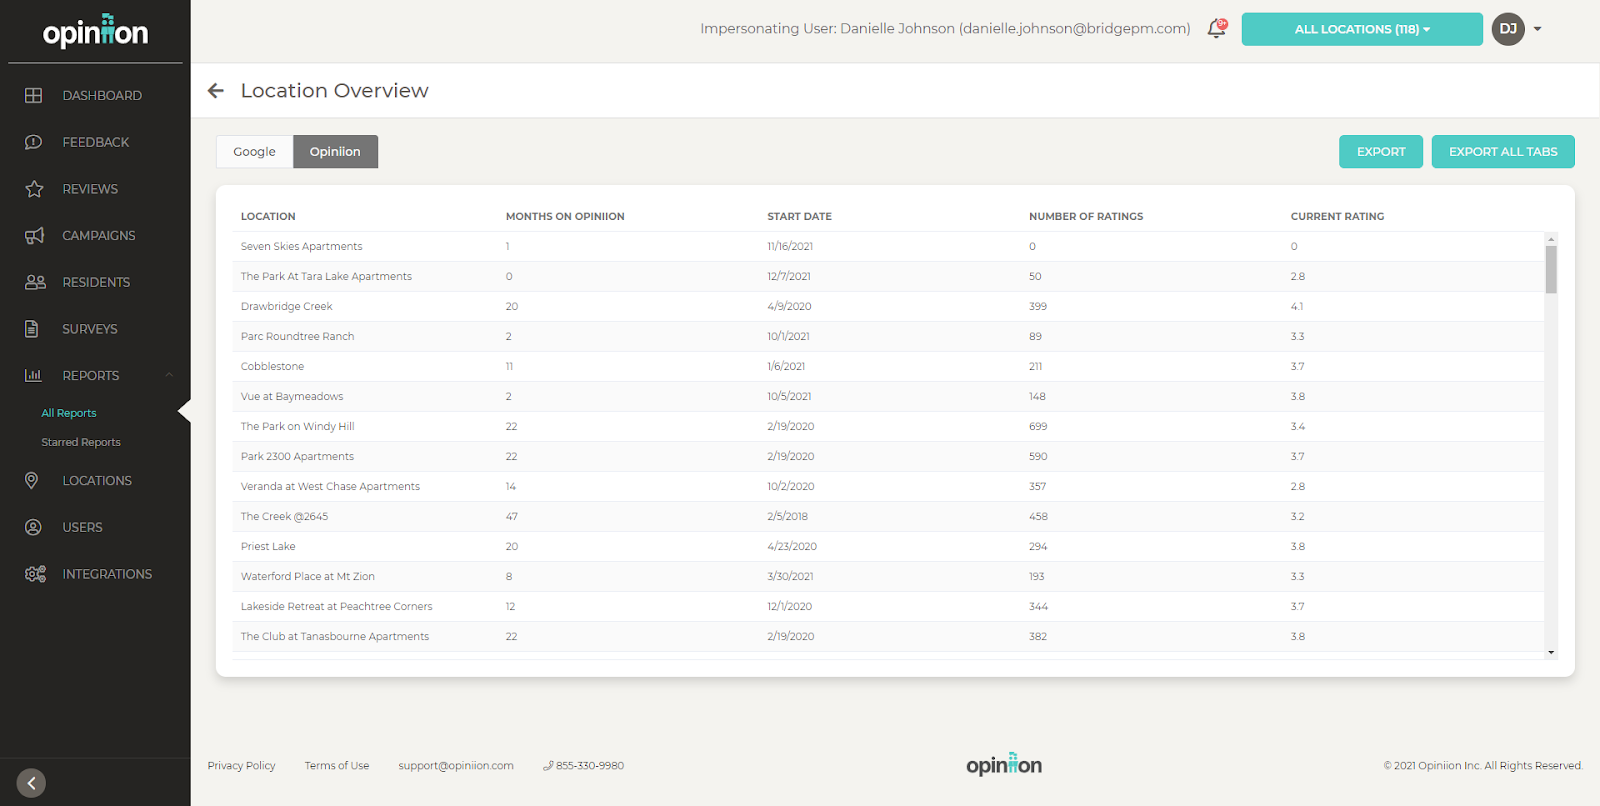
Here a user can see a detailed overview of their portfolio.
All locations assigned to a user will always be visible on this report.
If a user selects 1 location in the Locations Menu, the table will filter to show only the row for that location.
Additionally, there are two tabs, 1 for Google and 1 for Opiniion. Users can export all tabs or just the tab they are viewing.
The Reviews Added column includes all Google reviews Opiniion generated, plus everything that originated via other means.
This stat is not the same as the Reviews Generated on the dashboard. Reviews Generated is for all public reviews and only ones that Opiniion is responsible for.
Negative Feedback Captured by Year
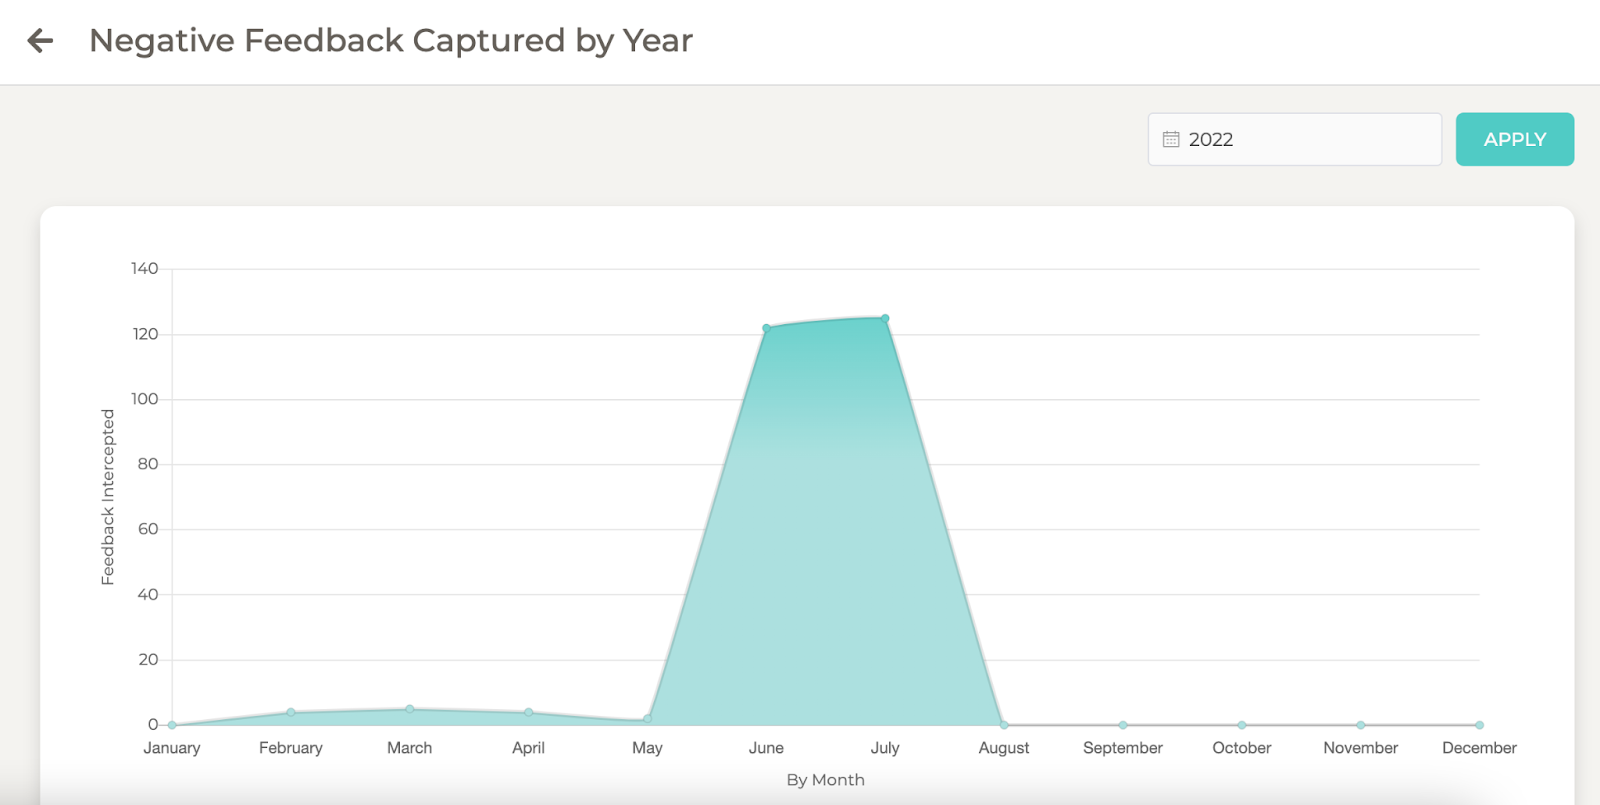
When a user clicks the Negative Feedback Captured card on the dashboard they will be directed to this report.
Here a user can see how many negative reviews were captured each month in a selected year.
Resident Satisfaction
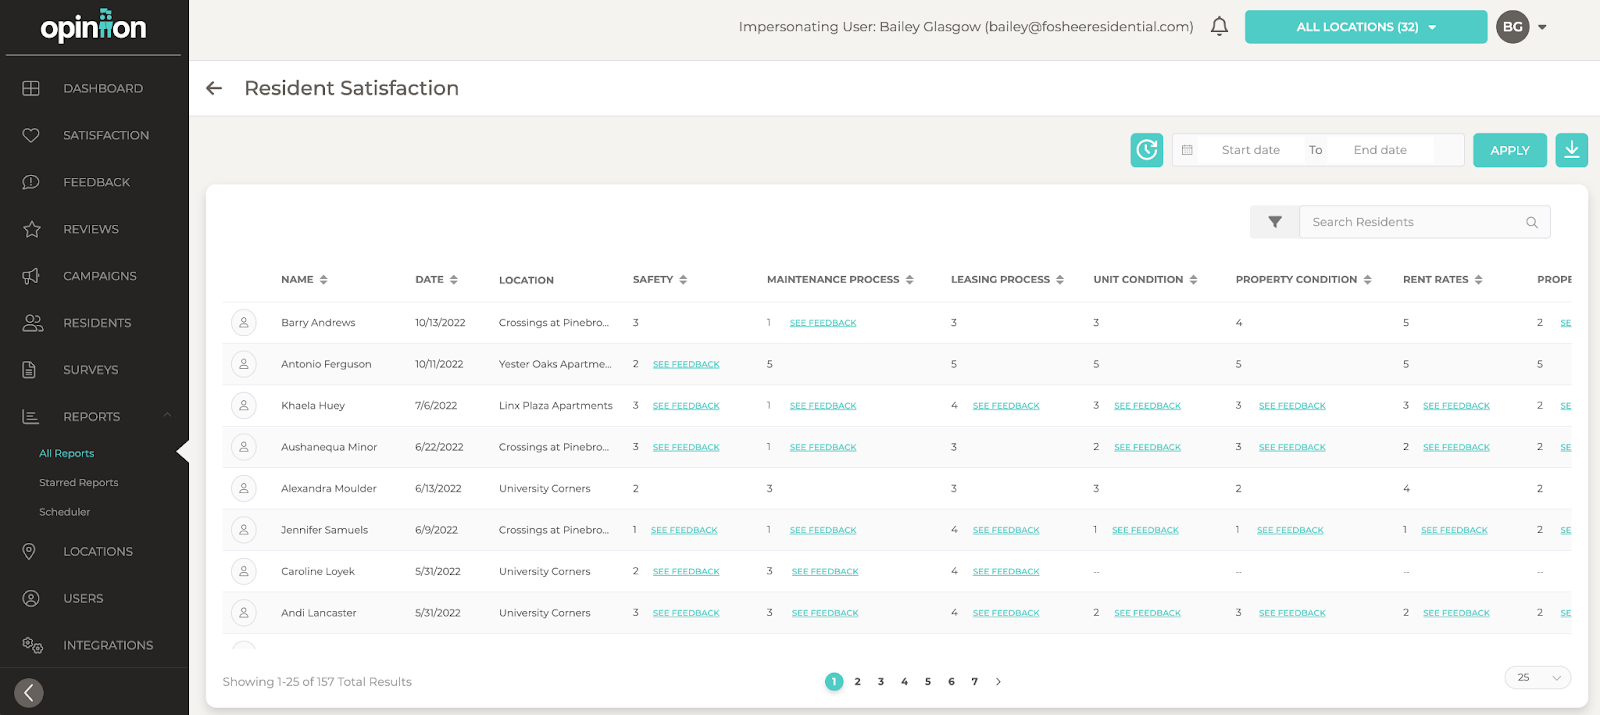
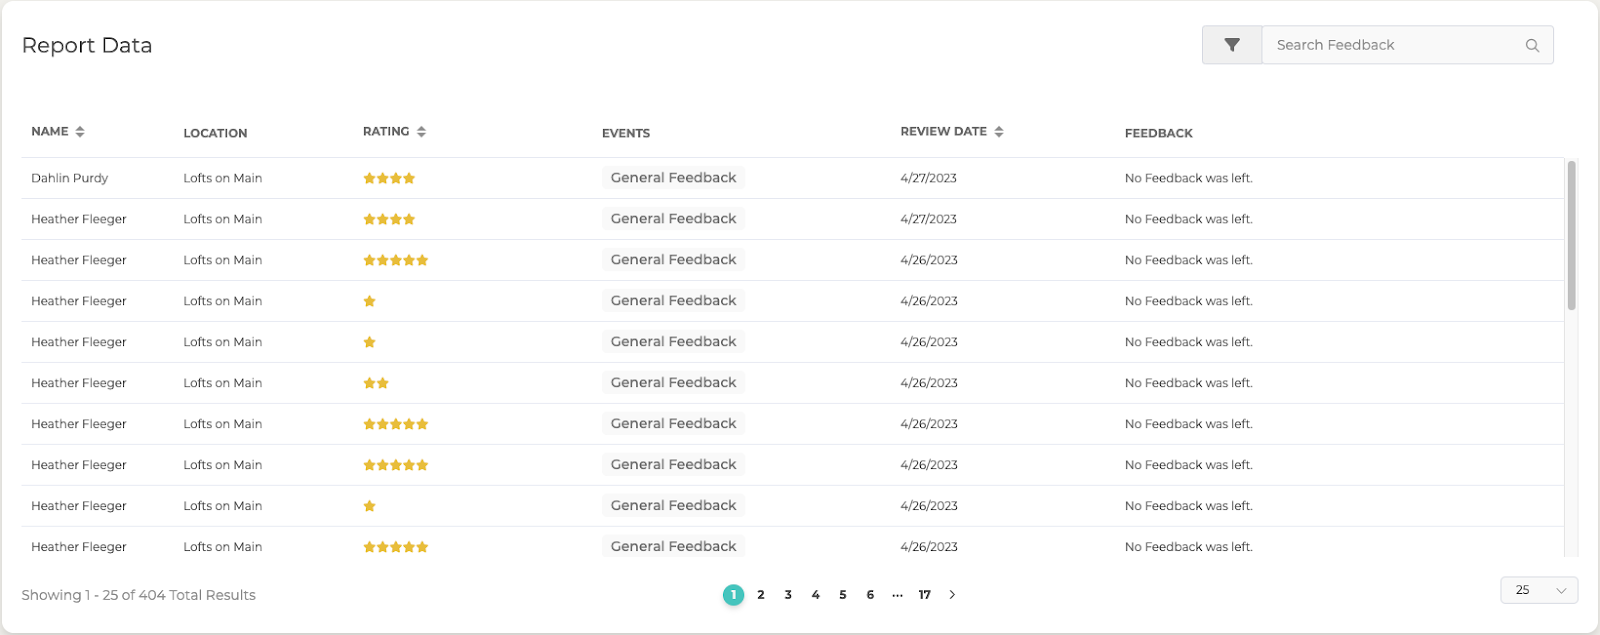
The Resident Satisfaction report lists every resident that has submitted data to this Smart Survey.
All columns are sortable, and will have a See Feedback option to view additional comments the resident left.
A user can set custom filters for each column by clicking the filter icon next to the search field.
Averages will display at the bottom of each column, and all data is exportable.
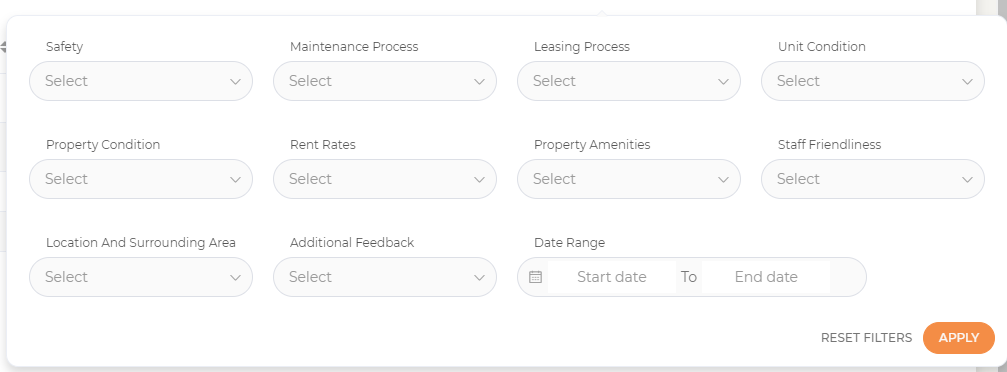
The order of the filters matches the order of the columns on the table.
There is also a date range picker located in this menu.
The data shown on the table will be filtered once a user clicks the Apply button, and Reset Filters clears all filters including the date range.
By default no filters or dates are selected.
Response Rate - Feedback
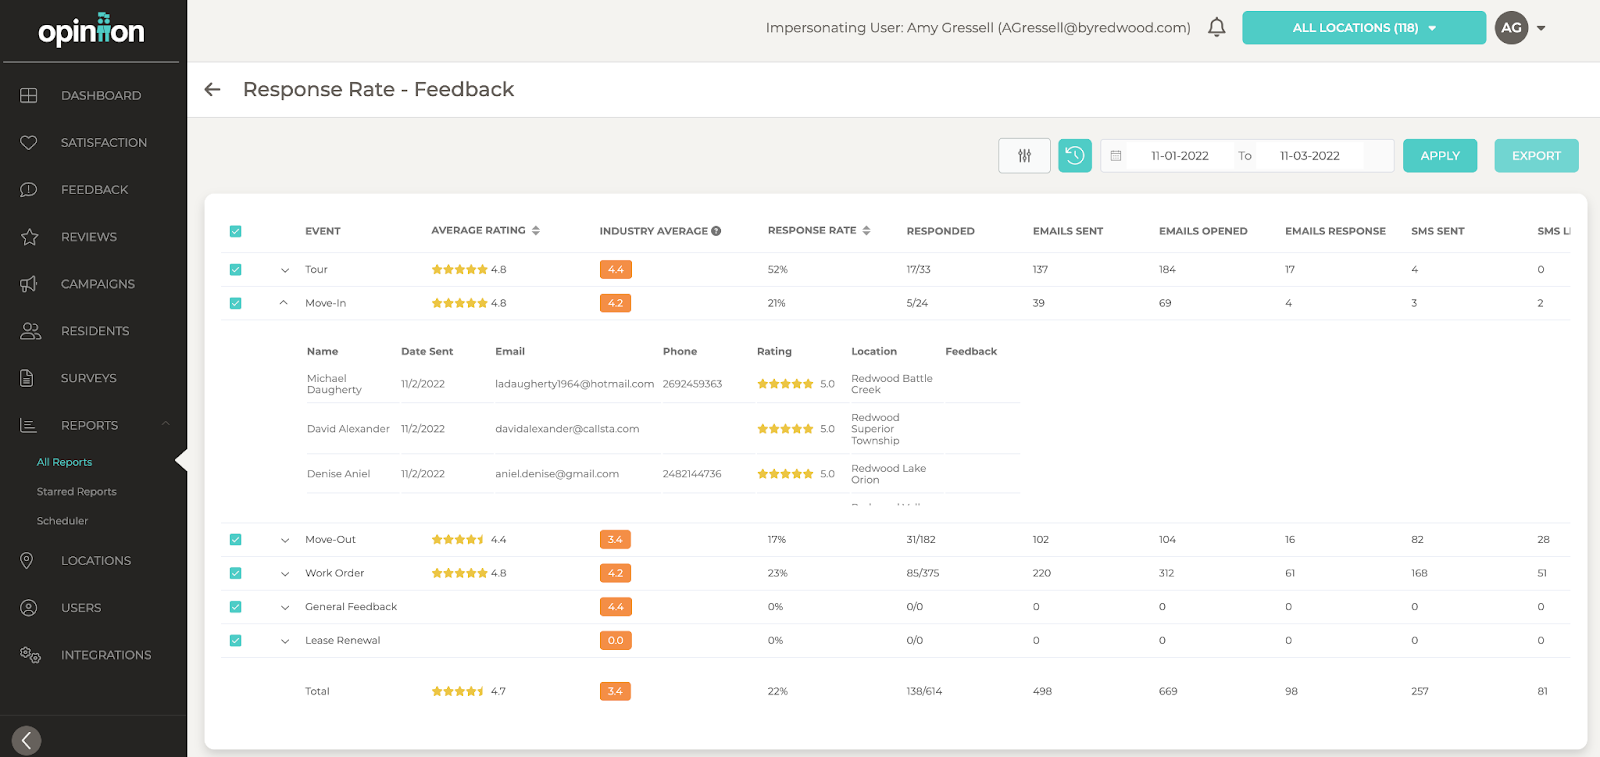
The Response Rate - Feedback report shows a user how many residents/customers are responding to their review request campaigns.
Response is defined as a 1-5 click, which means this report only lists campaigns that are type Review Request.
By default the date picker will be set to the last month.
Users can adjust this time by using the date picker and clicking Apply.
The Export button will only export the rows that have check marks.
Users can see a list of names and additional information below each Trigger.
They can also control which columns display by checking the box and hitting save.
Reviews by Source
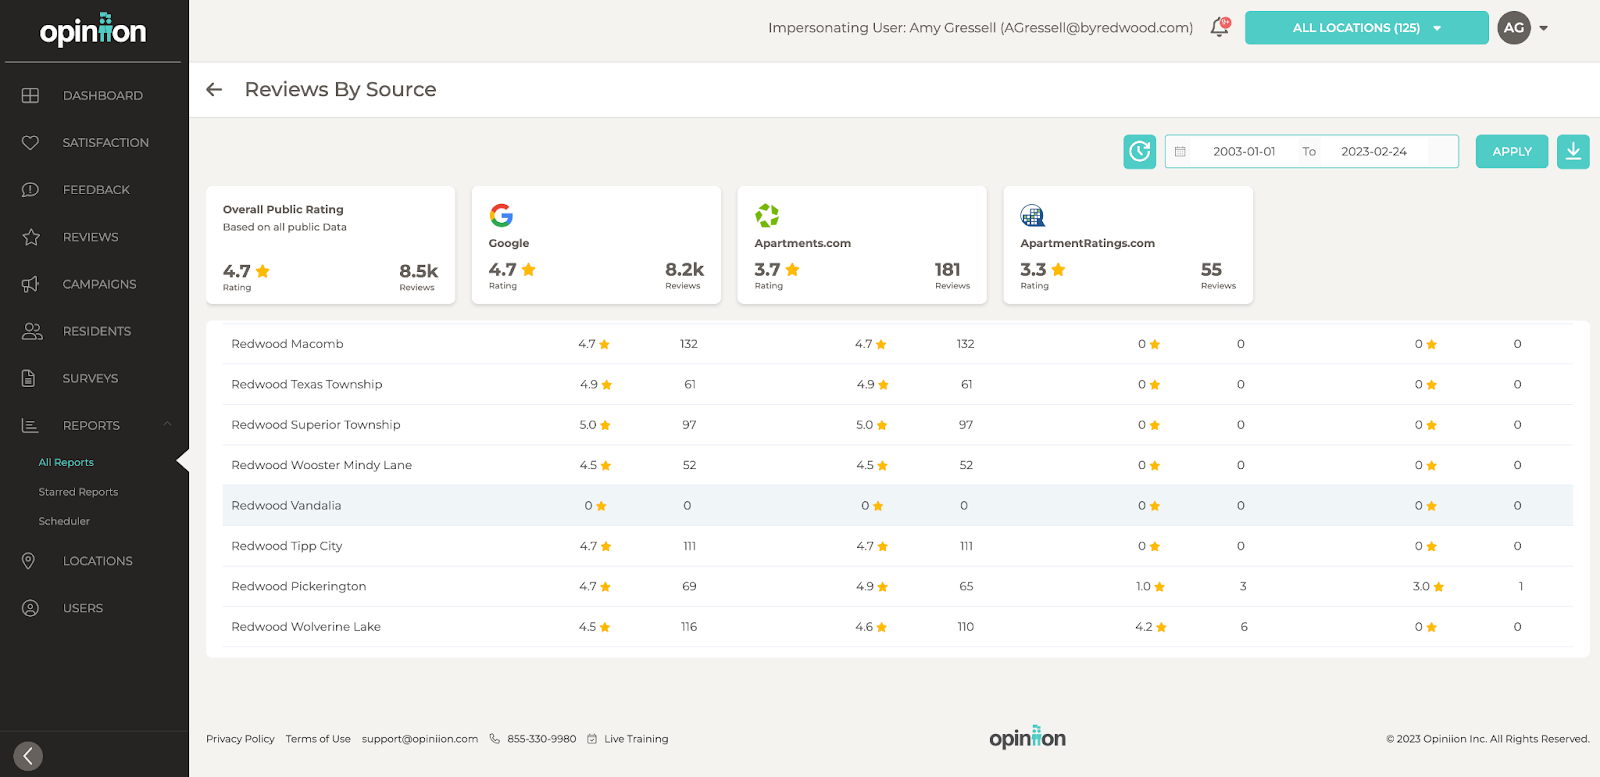
This report shows a breakdown of all public reviews across different sources
We show the number of reviews, and the rating on each review site
Here a user will have the option to adjust the time frame for the data that is displayed
There is a schedule and export option on this report.
Staff Performance
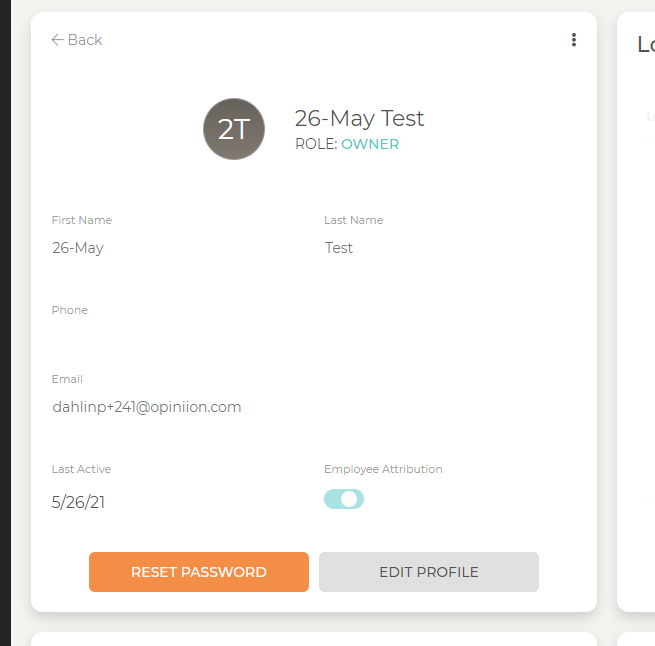
This report allows a user to analyze the type of Feedback being generated by different staff members. To enable/disable go to the user profile, click Edit Profile, toggle the switch, and then save changes. The following are available:
The following Integrations now support Work Orders for Staff Performance reporting:
Yardi
AppFolio
Buildium
Entrata
MRI
RealPage
RentManager
Resman
The following Integrations support Tours for Staff Performance reporting:
Yardi
Entrata
MRI
RealPage
RentManager
ResMan
Once Employee Attribution is enabled on the user, they will be able to see a new report titled Staff Performance on the reports page.
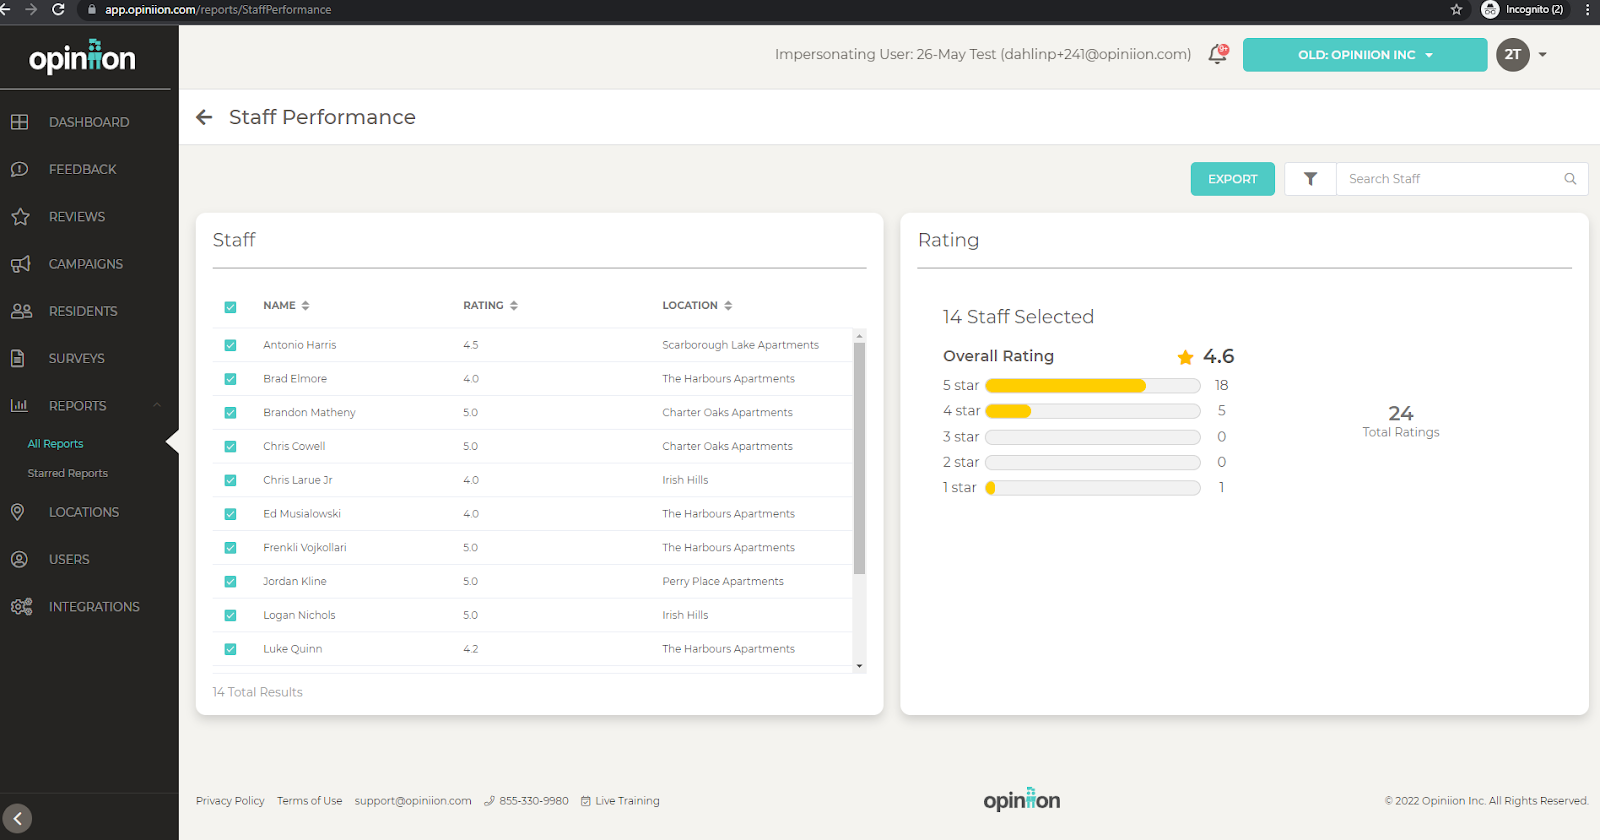
When viewing the report, users will see a list of staff members on the left.
By default all of the rows will be checked, and what is checked determines the data shown on the Ratings card on the right.
The users can see how many staff members are selected, their overall rating, and the total ratings.
Users can edit which rows are checked by clicking on the check box, which will then immediately update the data shown on the Ratings card.
Please note that the Export button will export all staff regardless of which boxes are checked.
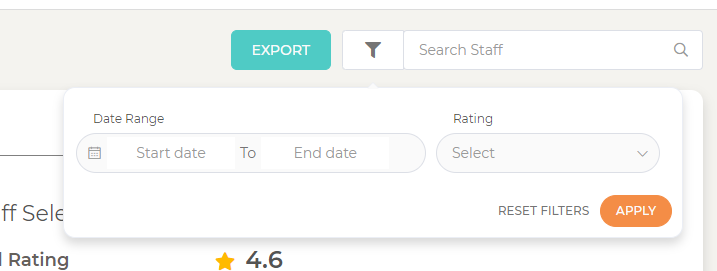
Users can search their staff by typing in their name.
They can also use the filter options that include a date picker (which filters by the date the rating was given), or by selecting a rating 1-5.
Users will need to click Apply to filter the data.
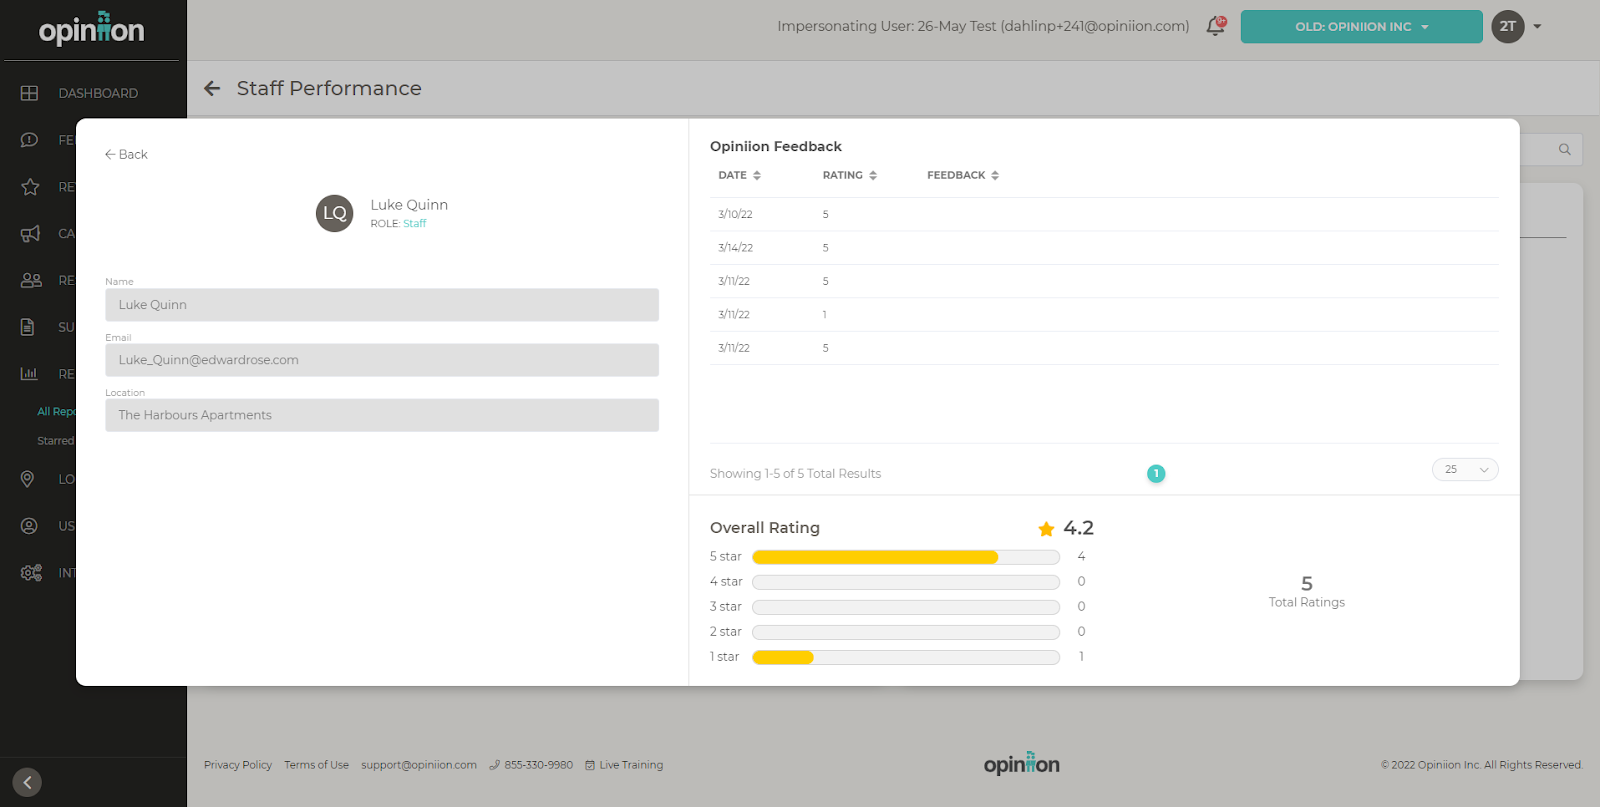
Users can click on a staff member's name to view additional details.
Here we list their name, email, location, all of the feedback they have received, and their overall rating.
The modal will close when click the Back option in the top left, or click outside the modal.
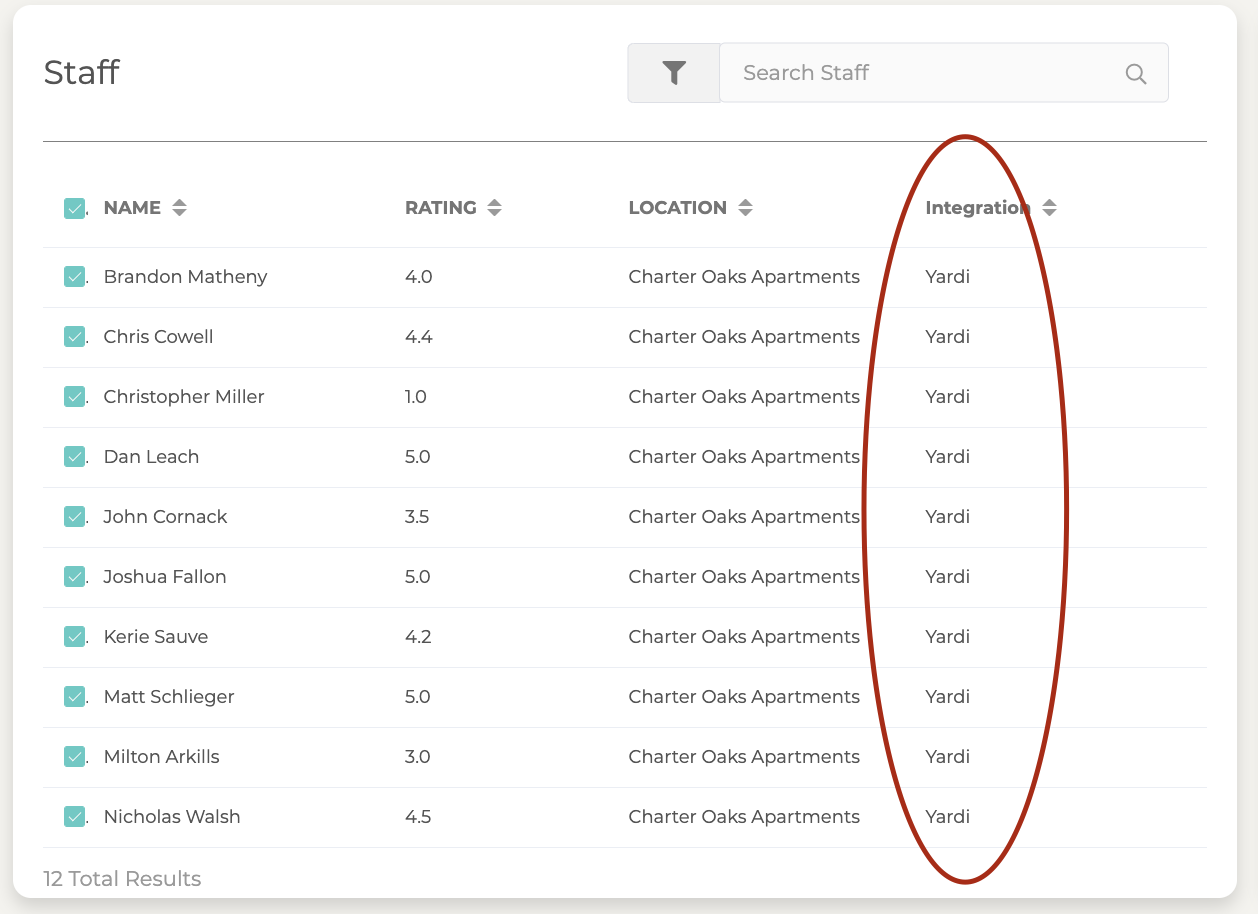
The report also includes a column to indicate what Integration the data is coming from.
Users can use these integrations for the report: Yardi and Realpage.
Yardi is set up to automatically pull this data over once we have turned it on for a user, but Realpage will require the user to update their process to include adding the maintenance worker’s first name, last name, and tech ID to the work order.
Standard Events Over Time
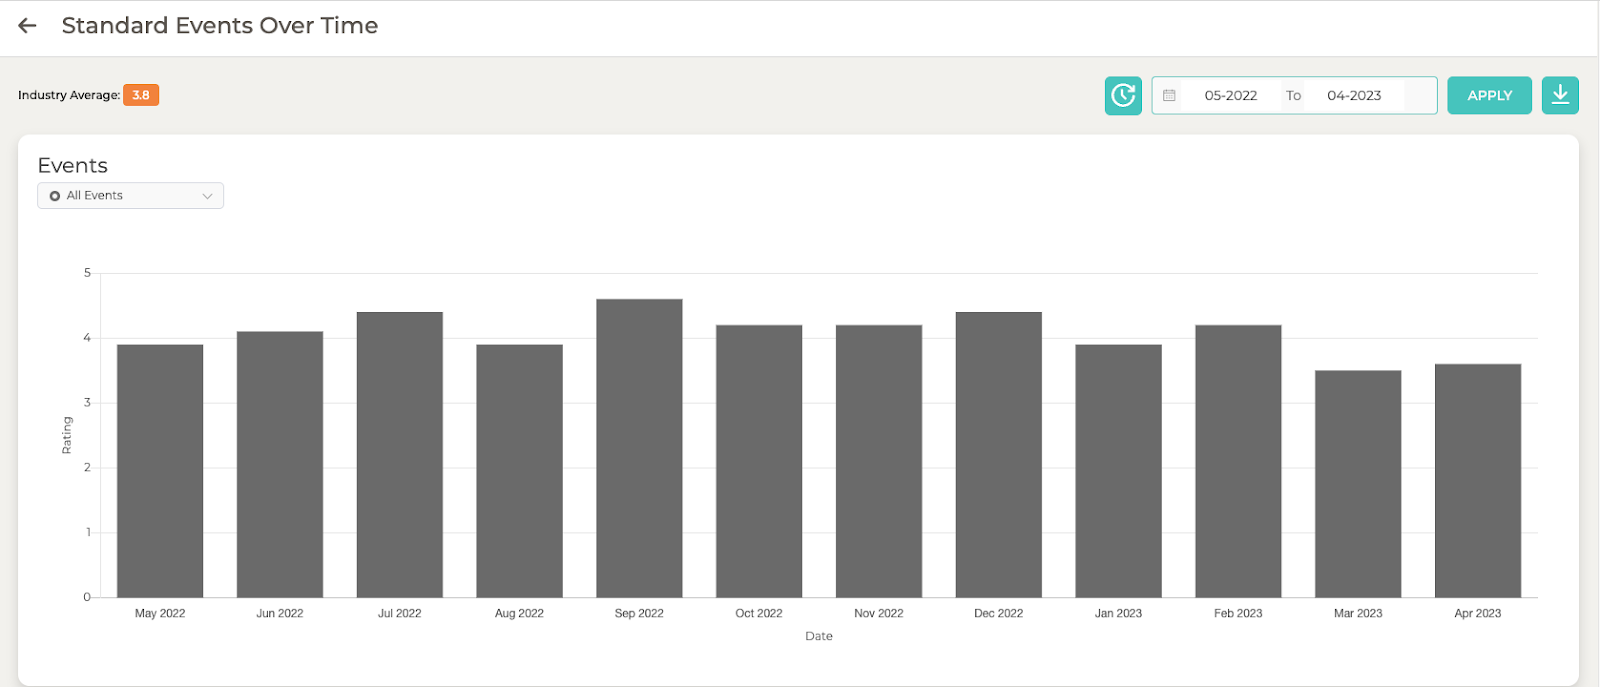
This report is intended to give users the ability to see rating and feedback trends directly from our standard triggers for review requests: General Feedback, Move-In, Move-Out, Work Order, and Tour. This report is only available to properties.
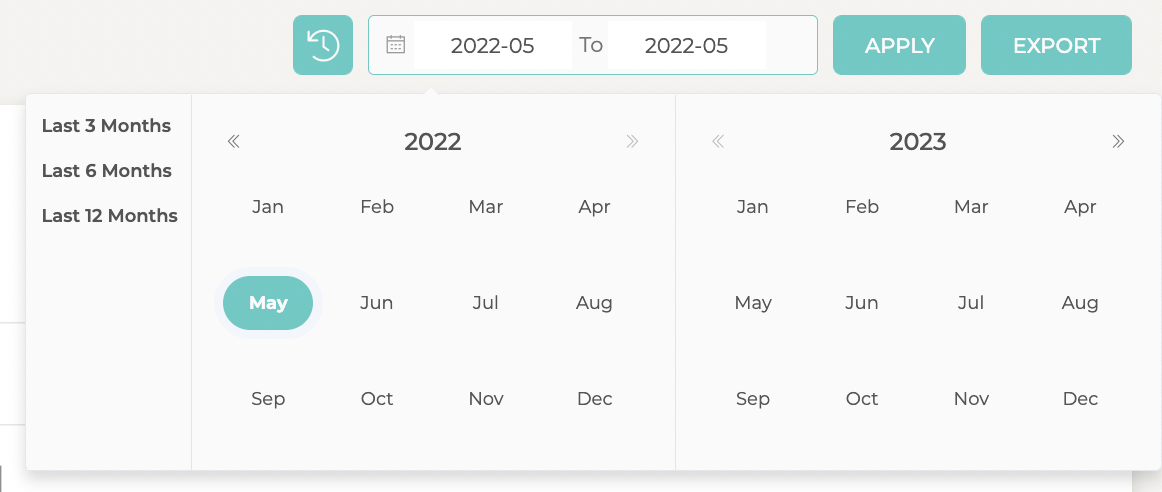
Upon navigating to the page, users will see all triggers selected and shown on the graph for all location(s) selected. The default date range will be the last 12 months.
The date range can be sorted by month and has default options in the box for the last 3 months, 6 months, or 12 months.
The data from the table can also be exported by selecting the export button in the top right corner.
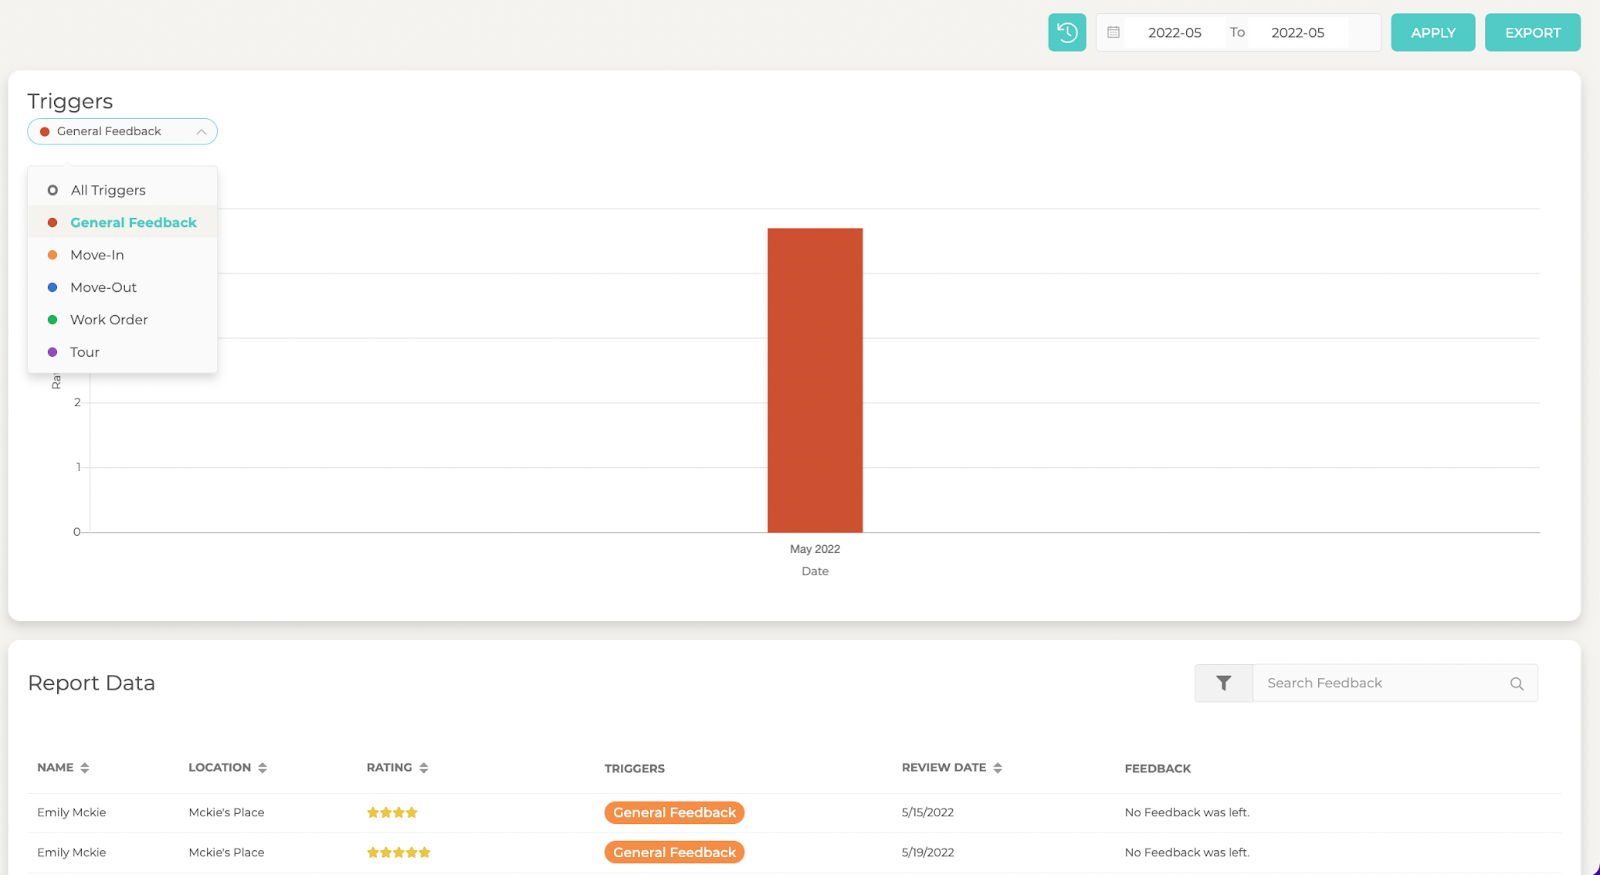
At the top left of the graph, users can select a single trigger or all triggers.
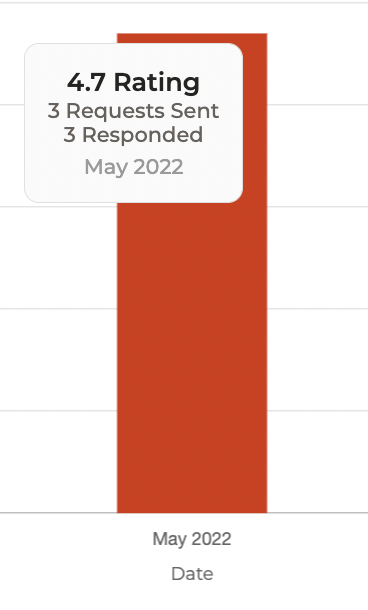
Hovering the graph will show a tooltip with the total amount of review requests that were sent and responded to for the trigger for that month as well as the rating.
Trending Reviews by Rating
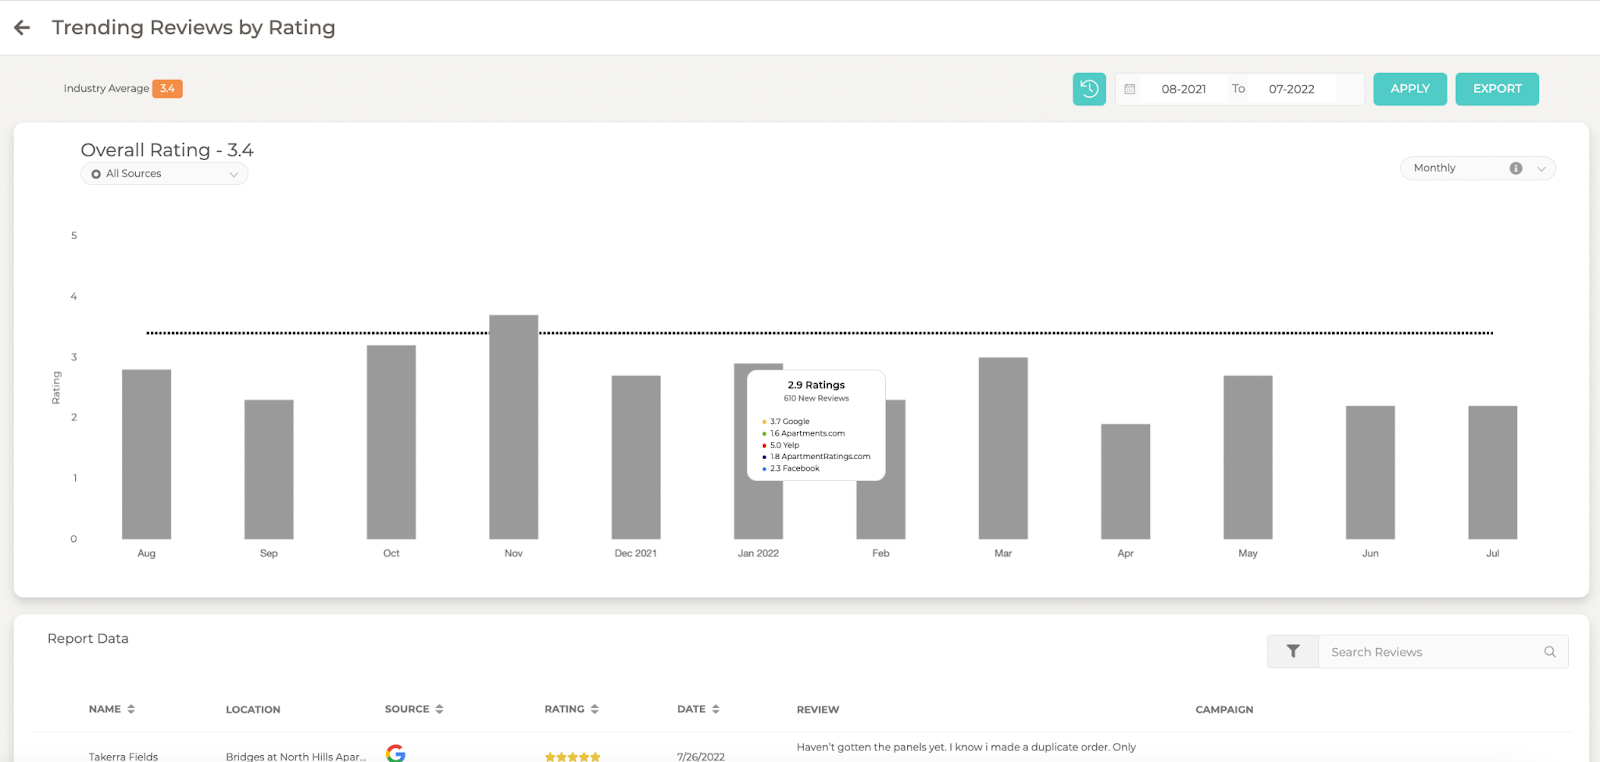
A user will be directed to this report when clicking the New Reviews Generated card on the dashboard.
This report allows a user to see their monthly and overall ratings for public reviews and what campaigns generated those reviews.
If the campaigns column is blank, that means Opiniion did not generate that review (this column will not show if a location has not been GBP linked).
By default we will show the last year for this report, however a user can change it using the date range.
This report will filter based on what is selected in the locations menu, the data is exportable, and this report is available to all industries.
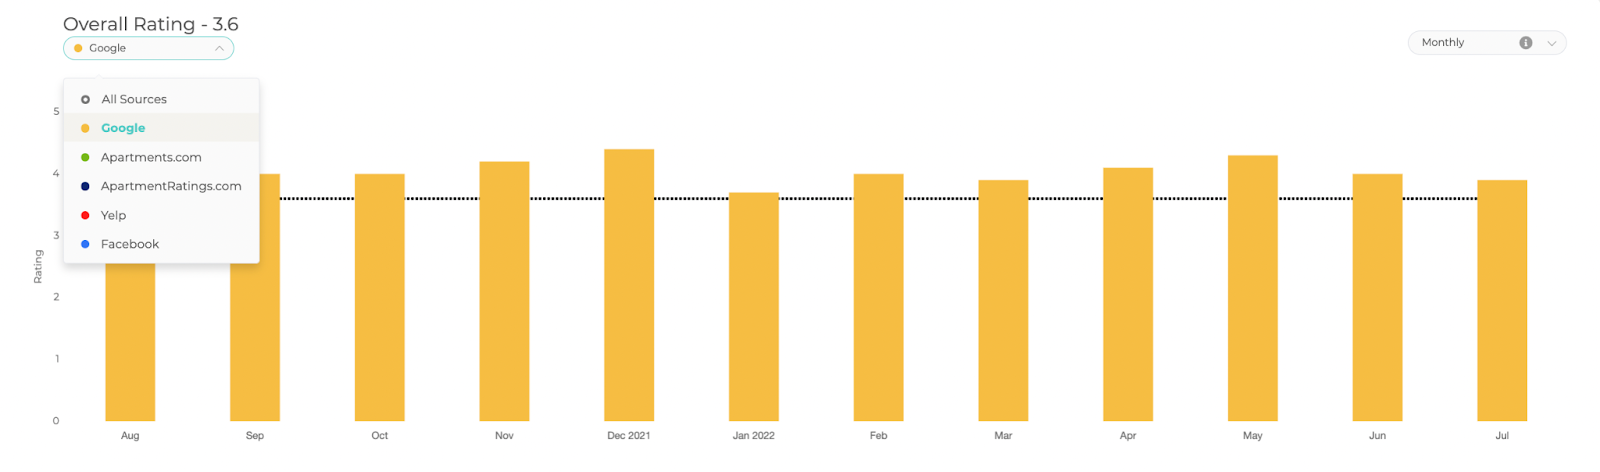
Users can also select a source from the top left corner of the report (Apartments.com and ApartmentRatings.com are not available to services).
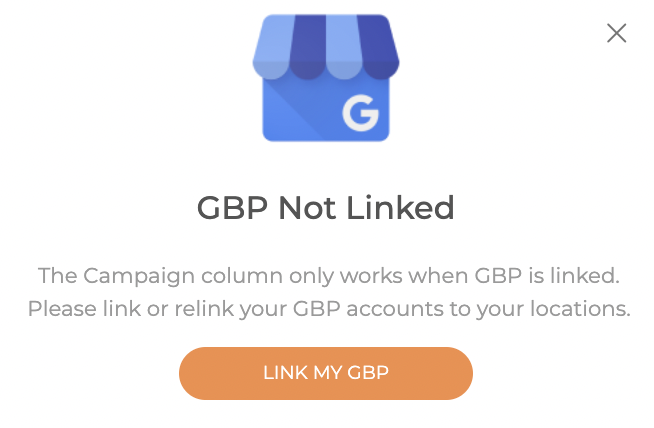
A modal will pop up automatically prompting the user to link their GBP and also informing them the report requires this feature.
Please note: If a resident or customer is marked as Matched on the Resident/Customers page, but doesn’t show a campaign on this report, it means they were previously matched to a review that they either choose to manually delete, or manually change by going directly to Google.
Trending Reviews by Volume
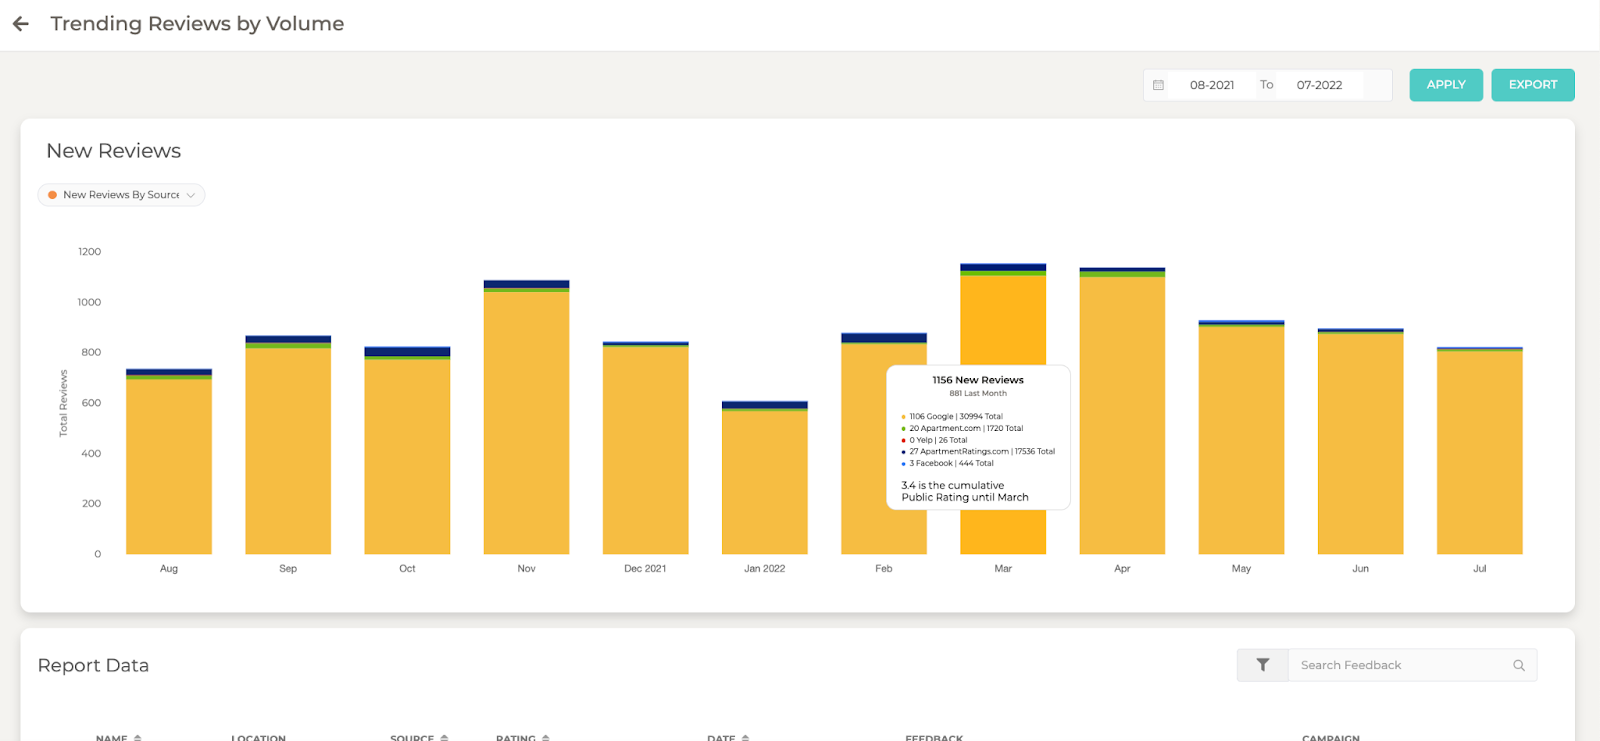
A user will be directed to this report when clicking the Google Review Timeline on the dashboard.
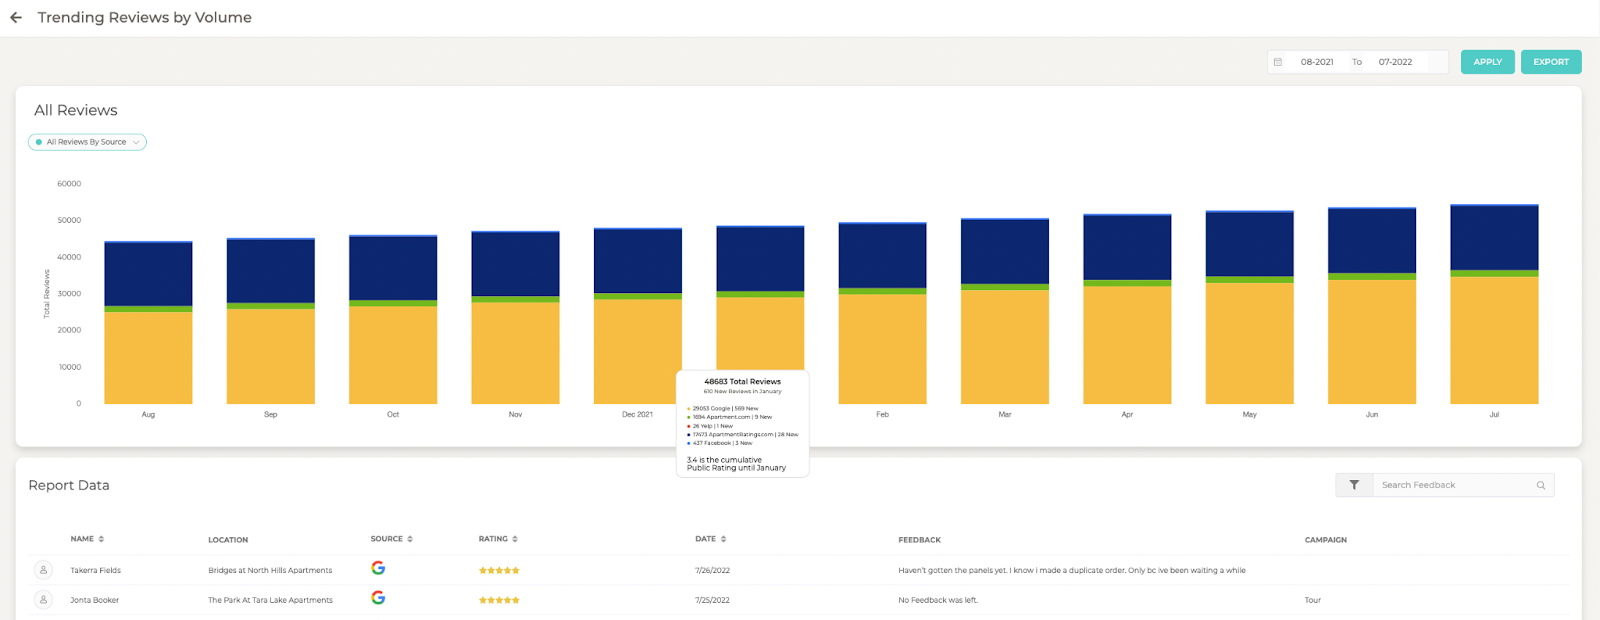
Here a user can see much of the same information, but will be able to see totals for all public sources, and adjust the time frame.
If the campaigns column is blank, that means Opiniion did not generate that review (this column will not show if a location has not been GBP linked).
By default we will show the last year for this report, however a user can change it using the date range.
This report will filter based on what is selected in the locations menu, the data is exportable, and this report is available to all industries.
Please note: If a resident or customer is marked as Matched on the Resident/Customers page, but doesn’t show a campaign on this report, it means they were previously matched to a review that they either choose to manually delete, or manually change by going directly to Google.
By default it will show the past 12 months. Users can see table data and a bar graph visualization from the selected date range by month.
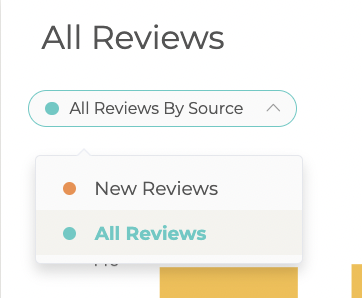
The drop down menu in the top left corner of the graph can be alternated between “New Reviews” and “All Reviews,” but the default is set to “New Reviews.”
Word Analysis
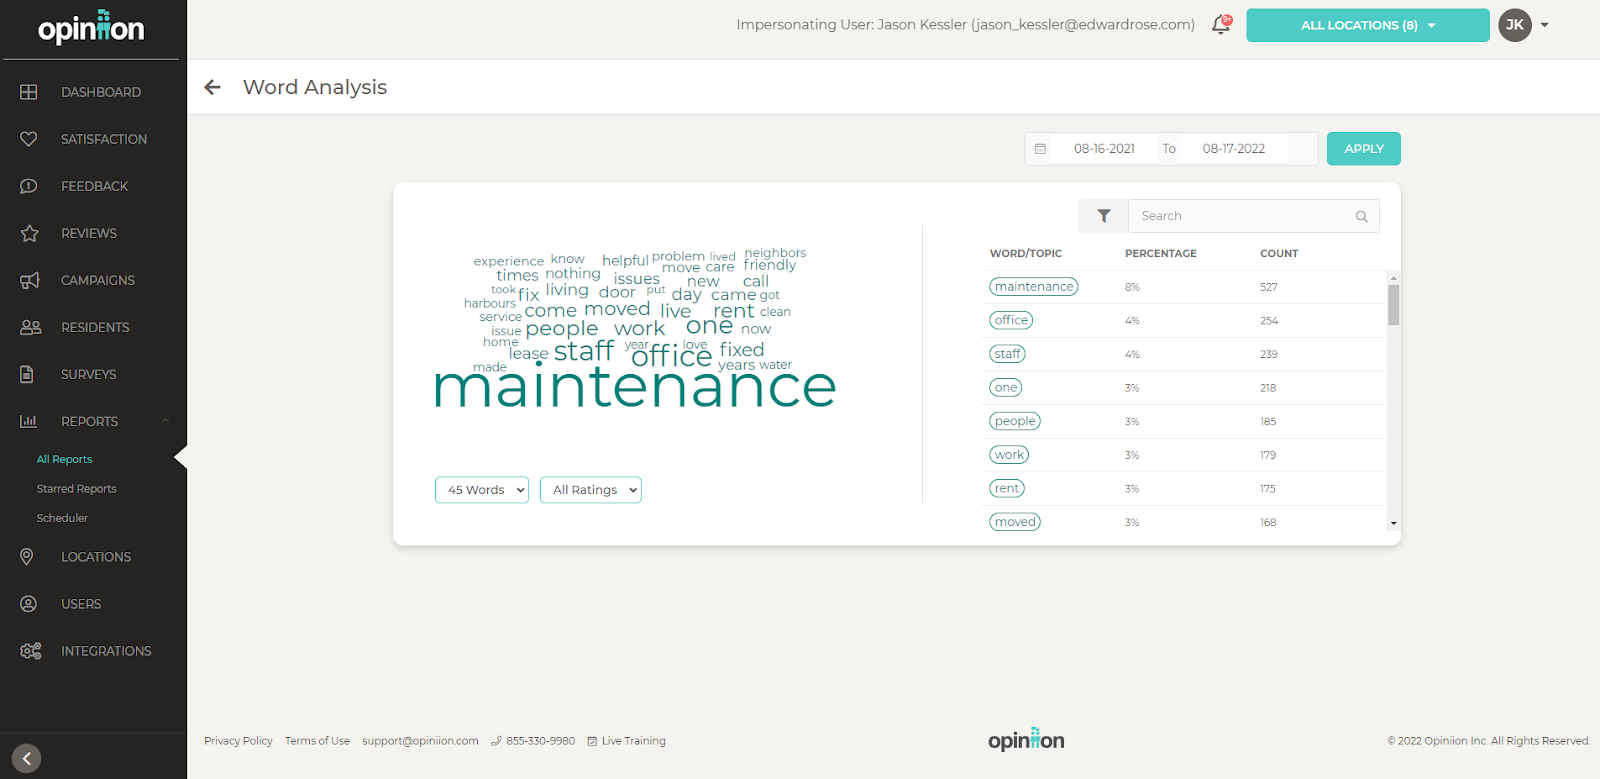
The Word Analysis looks at trending words across all public reviews and all private feedback.
The more mentions a word receives, the larger the word will appear.
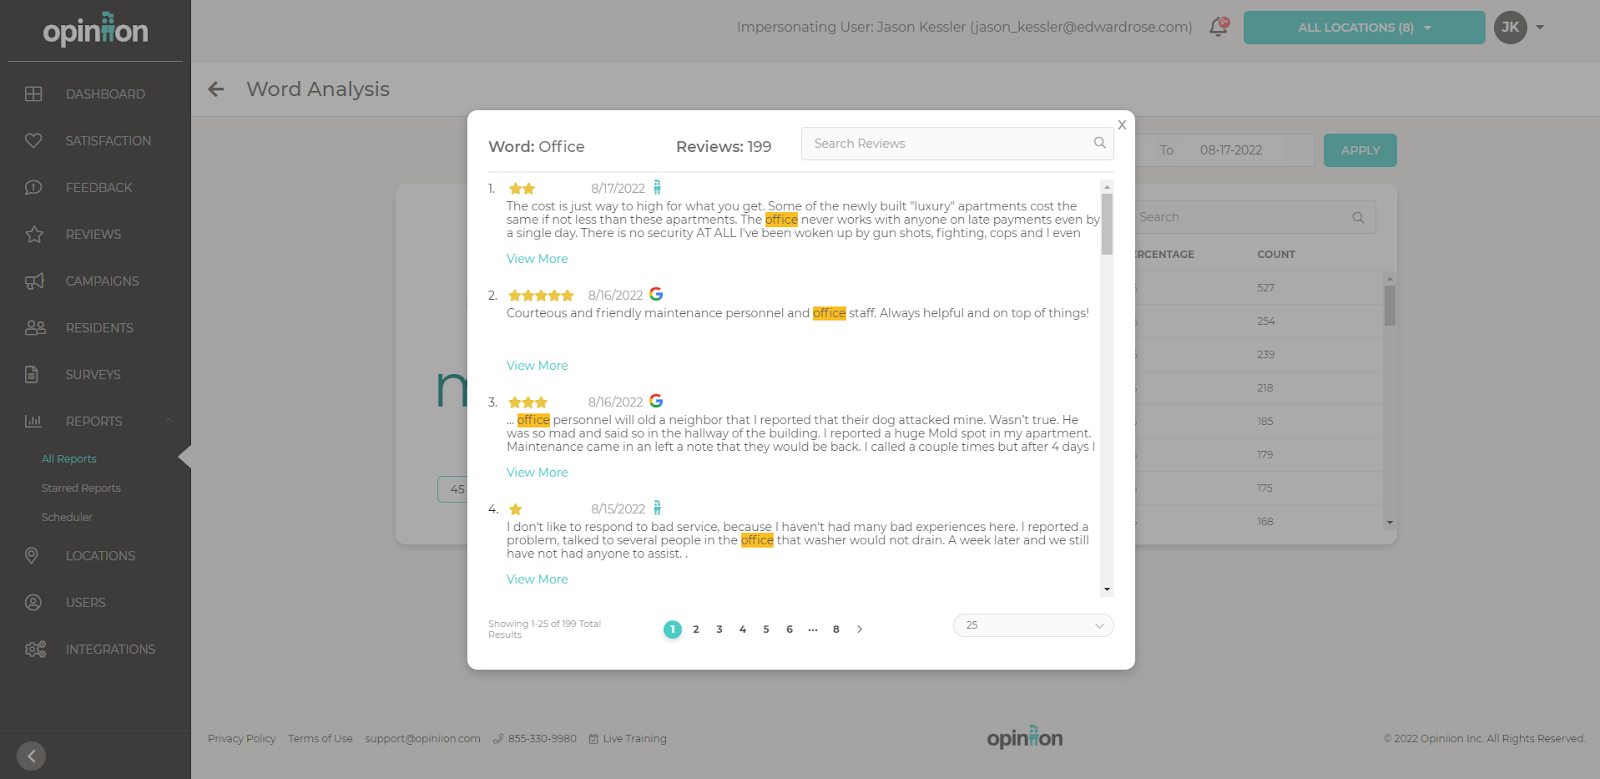
If a user clicks on a word it will open a modal that will display all the feedback and/or reviews that include that word.
The word that was clicked will be highlighted.
There they can see who left the review, location, and the campaign it came from (if a public review isn’t matched it will NOT list a campaign).
Users have the option to filter by the number of words and positive, negative, or all.
Next to the search we have a filter for campaign and source.
Starred Reports
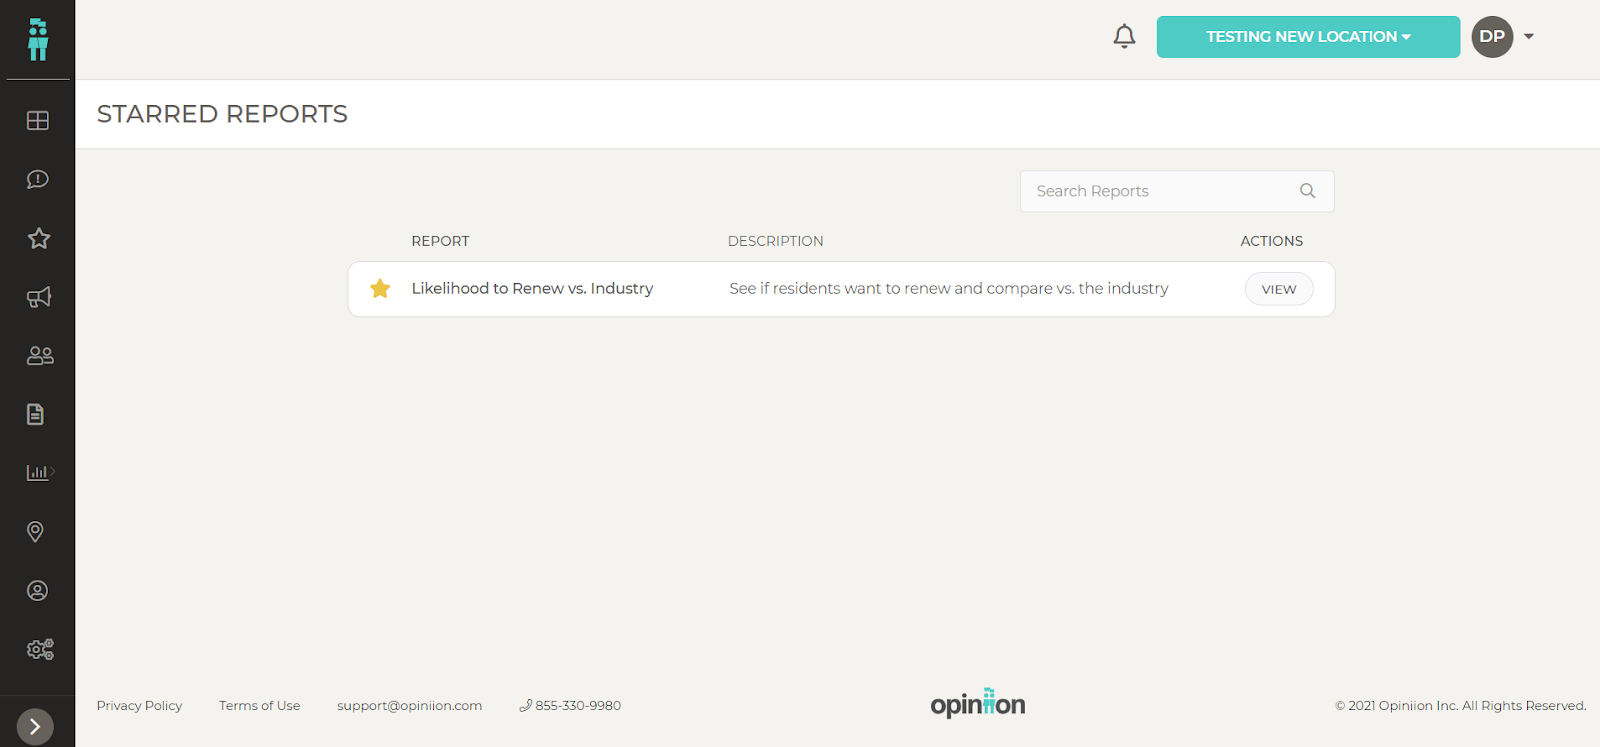
Not all reports are used by all locations. For this reason we allow a user to star the reports they most use, and display those reports on the Starred Reports page
Scheduled Reports
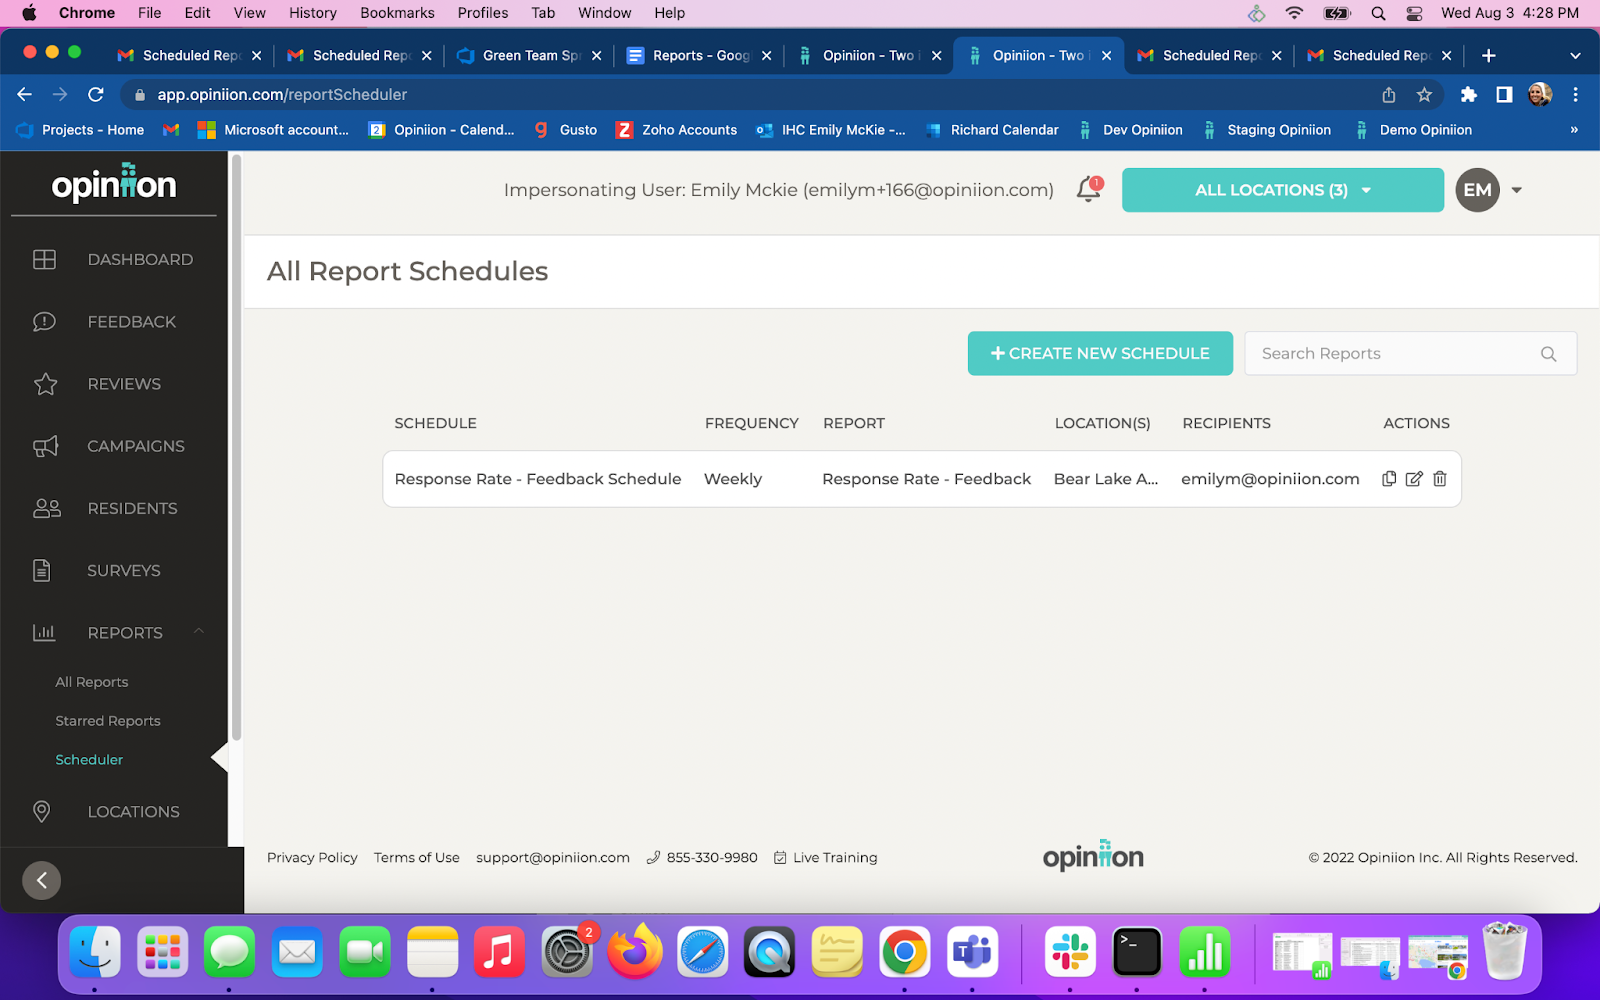
Users can schedule reports to send automatically to themselves and other users via email.
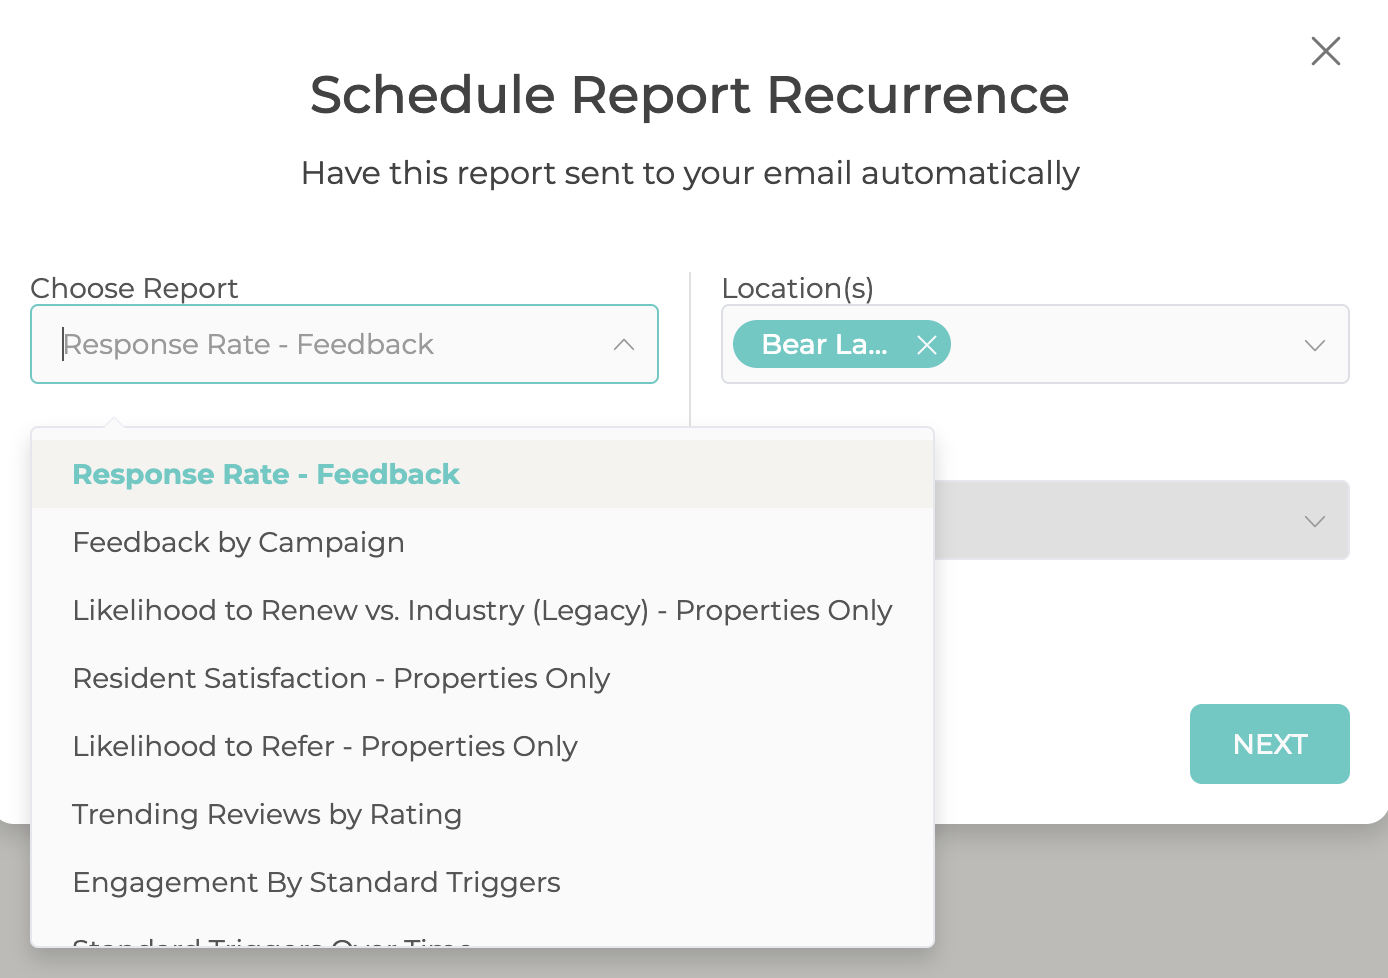
This feature is available for the following reports:
Response Rate - Feedback
Users Page
Engagement By Survey
Reviews by Source
Feedback by Campaign
Resident Satisfaction - Properties Only
Likelihood to Refer - Properties Only
Trending Reviews by Rating
Engagement By Standard Events
Standard Events Over Time
Feedback By Standard Events
Trending Reviews by Volume
Staff Performance
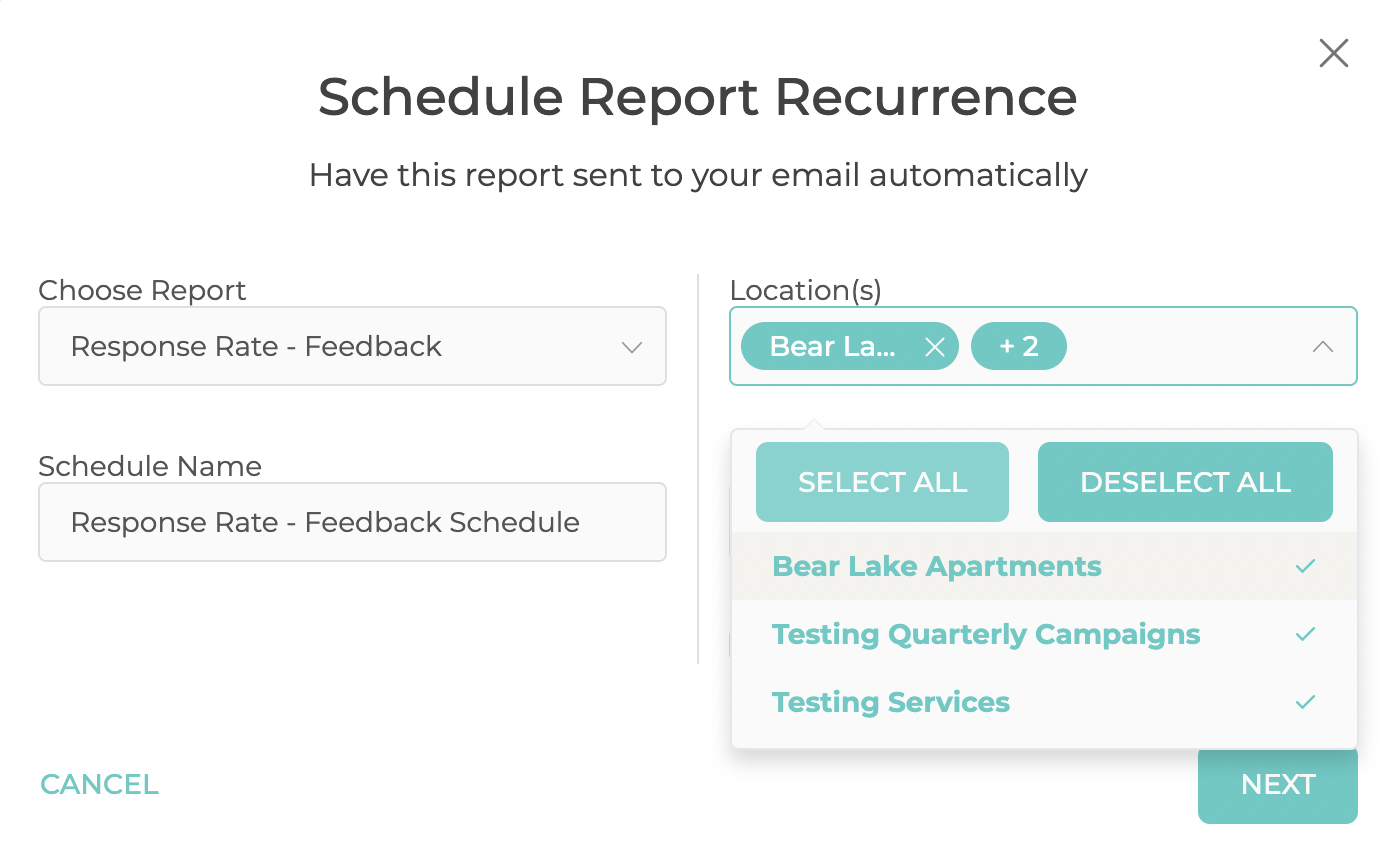
Custom names can be made for the schedule and can be set up for 1 location or multiple locations.
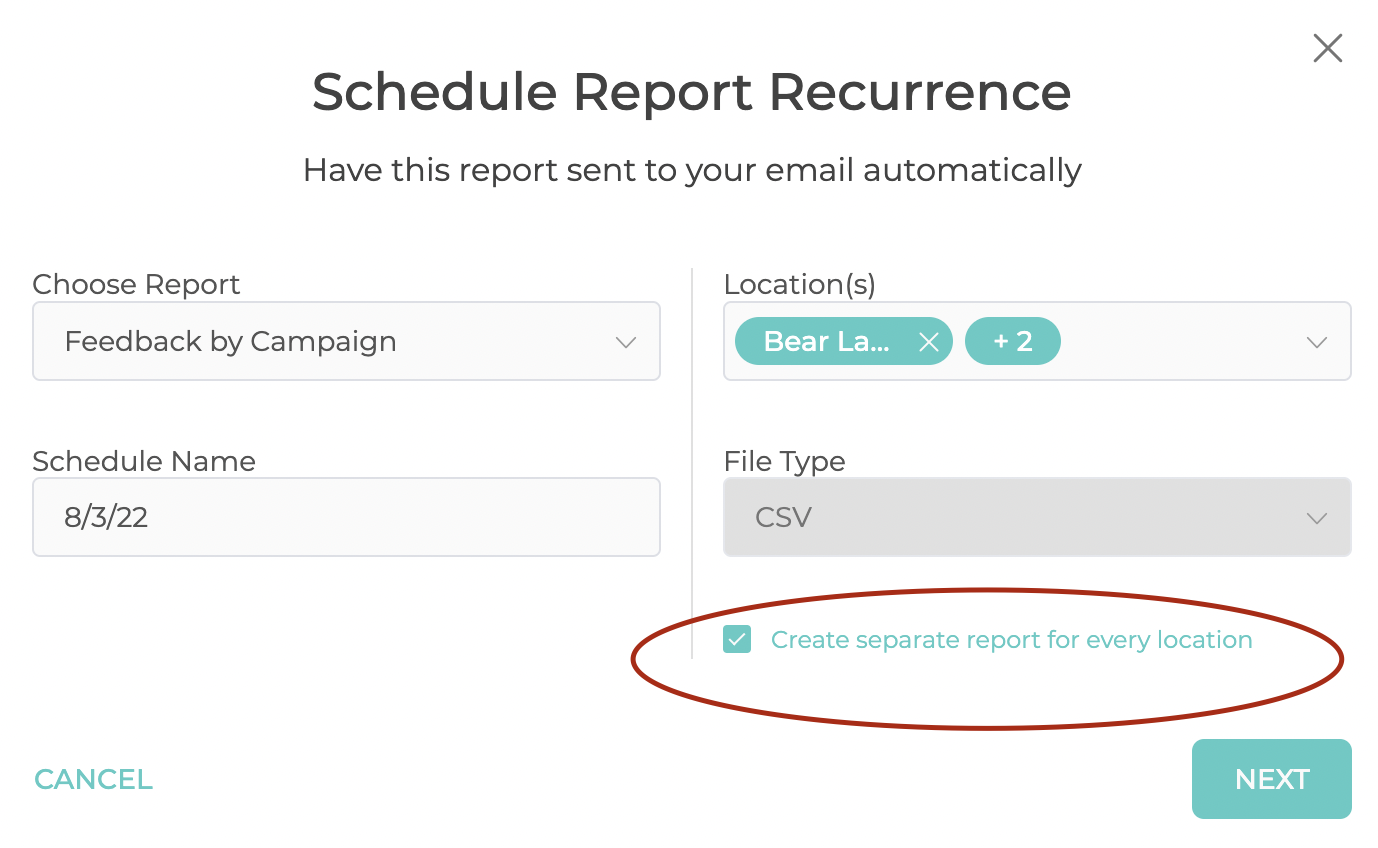
By clicking this box, the reports for each location will come as a separate .csv in the email.
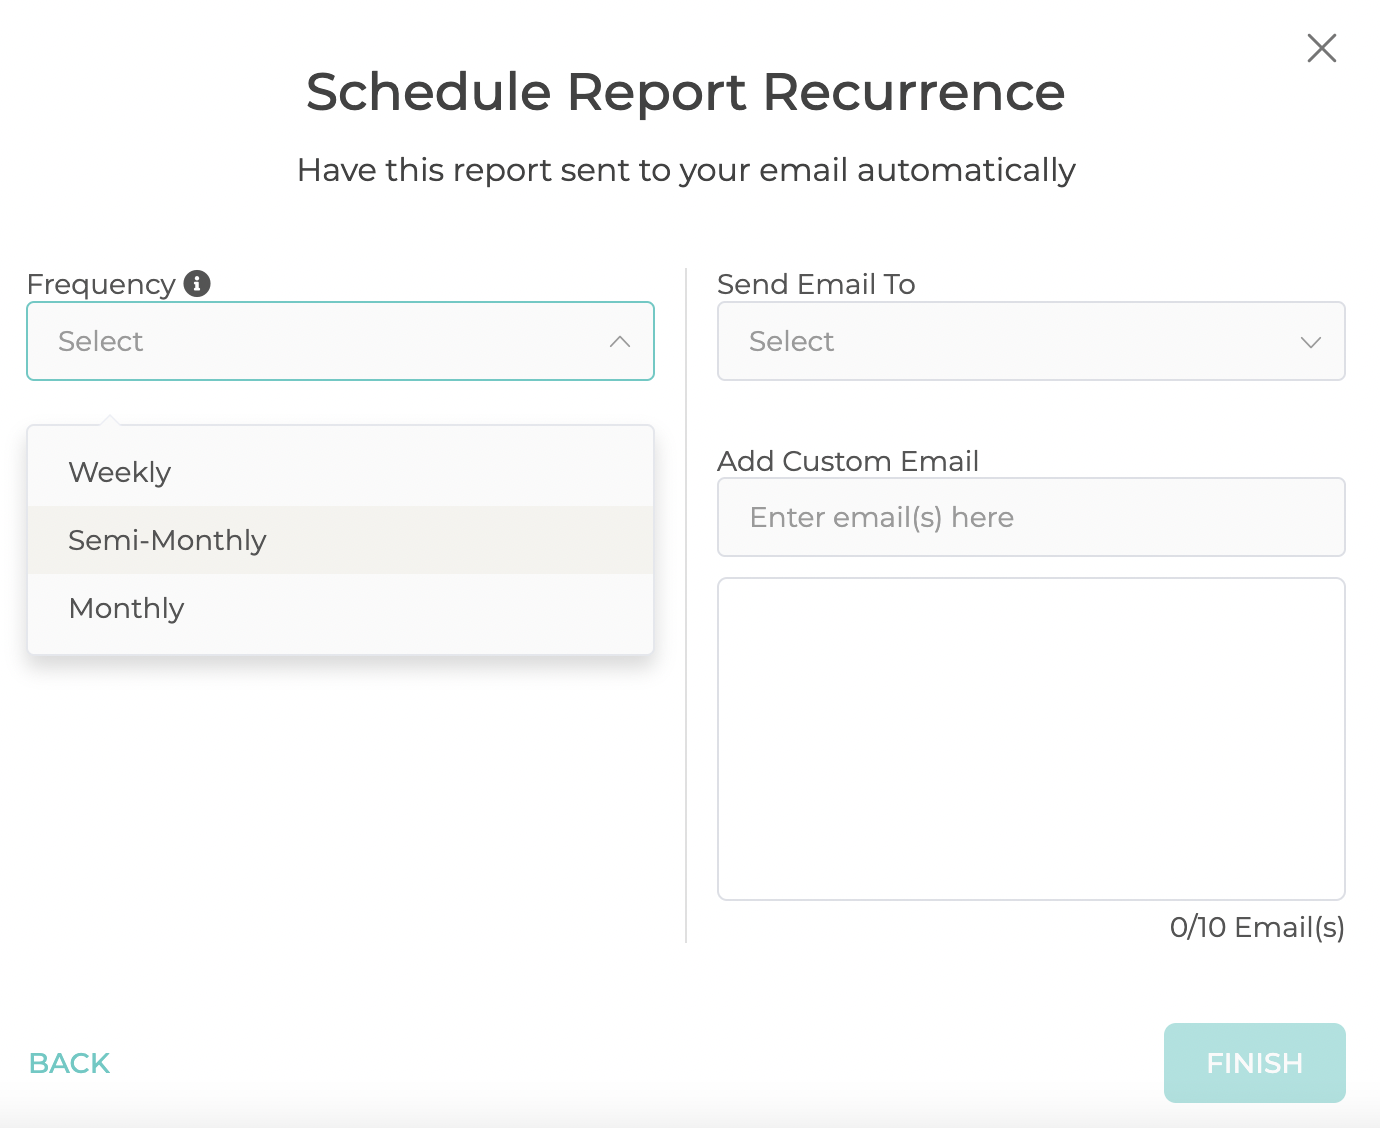
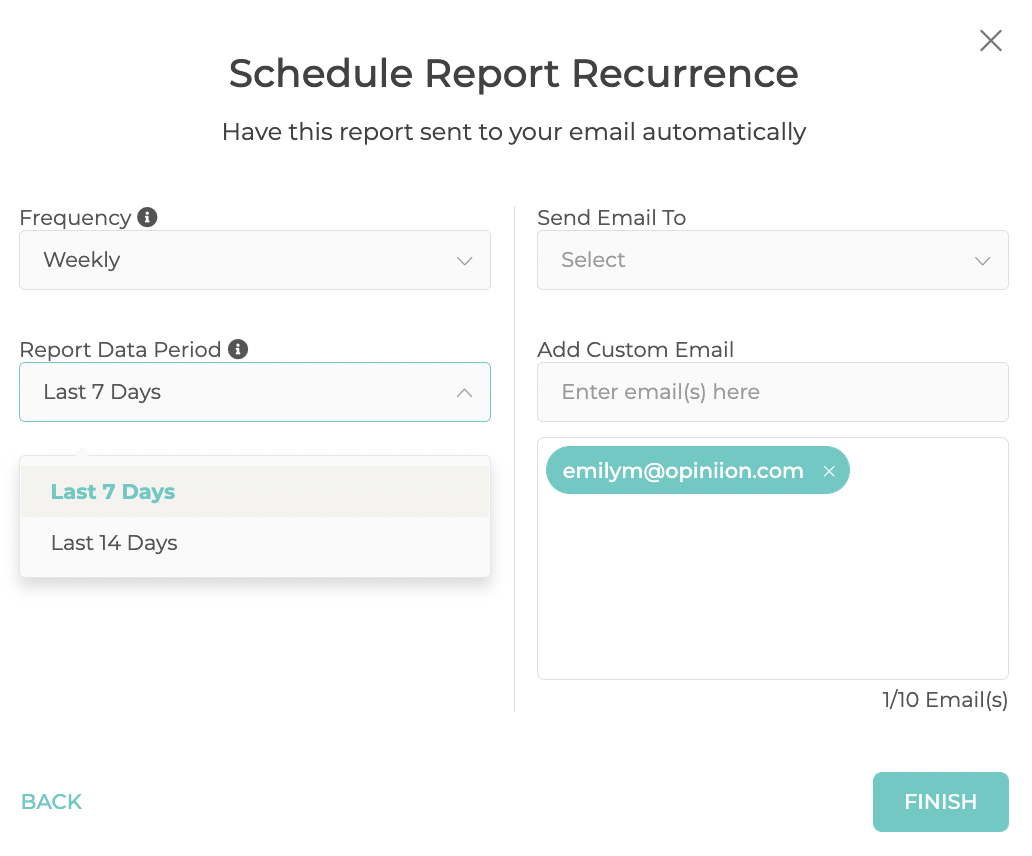
Users can select one of the 4 frequencies/Date Period we provide:
Weekly:
Interval: Monday, Tuesday, Wednesday, Thursday, Friday, Saturday, Sunday
Data Period: Current Week (Data week starts on Sunday) Last 7 Days, Last 14 Days, Current Month (MTD) or All Time Data
Monthly:
Interval: 1, 2, 3, 4, 5, 6, 7, 8, 9, 10, 11, 12, 13, 14, 15, 16, 17, 18, 19, 20, 21, 22, 23, 24, 25, 26, 27, 28, 29 30, 31
Data Period: Current Month, Previous Month, Last 30 Days, or All Time Data
Quarterly:
Interval: Date Picker (day, month, year)
Data Period: Current Quarter, Previous Quarter, Previous 2 Quarters, or All Time Data
Yearly:
Interval: Date Picker
Data Period: Current YTD, Previous Year, Last 2 Years or All Time Data
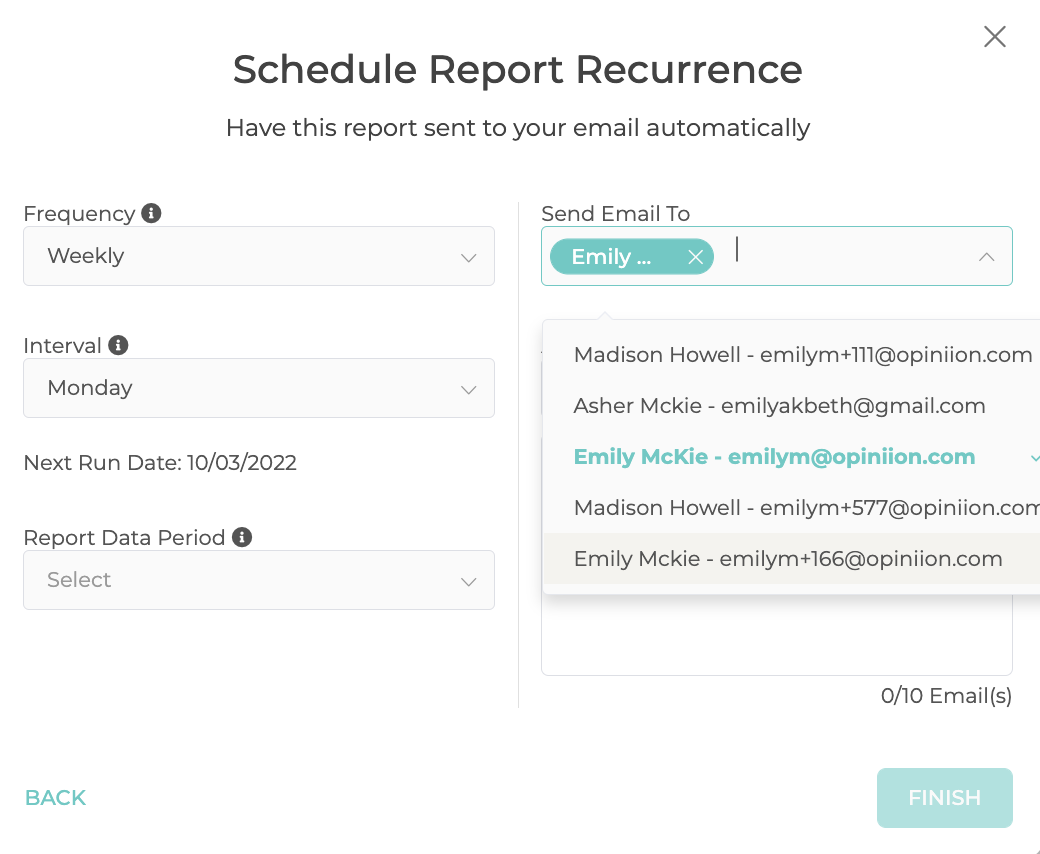
Users can list up to 10 emails they want the report to send to manually and an unlimited amount using the dropdown with users assigned to the location(s).
When users want to add an email manually they will need to type it into the Email input and then hit enter.
When users click on this icon on any of the applicable reports, then it will direct them to the Scheduler page with that report name in the search bar.
Any other reports that coincide with the name that already exist will show in the list.
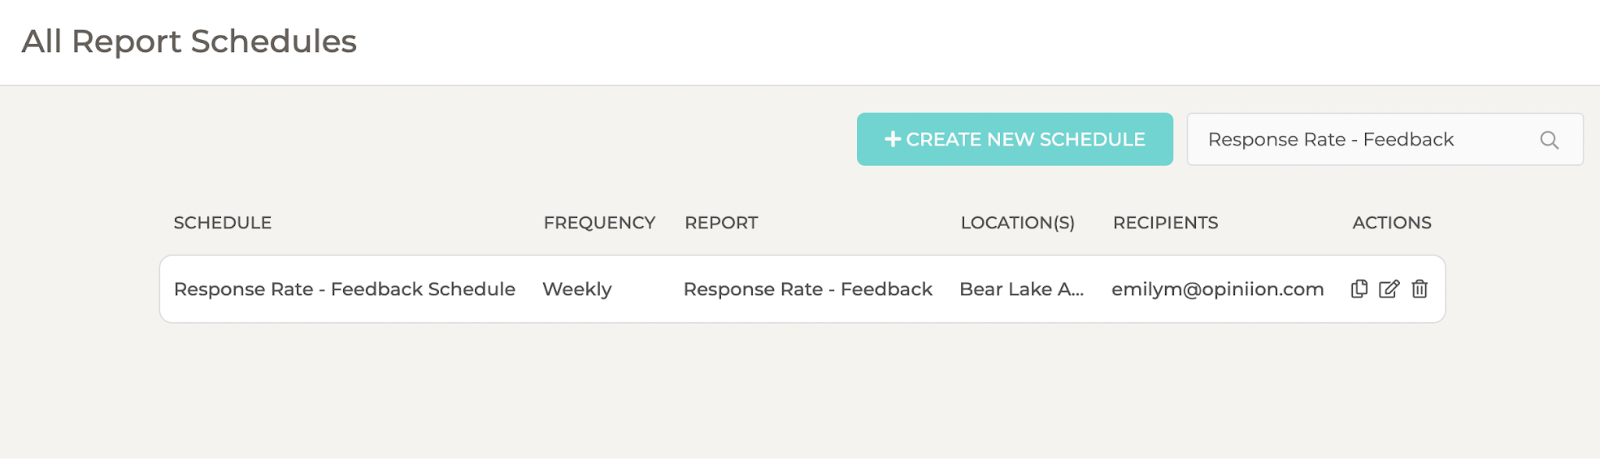
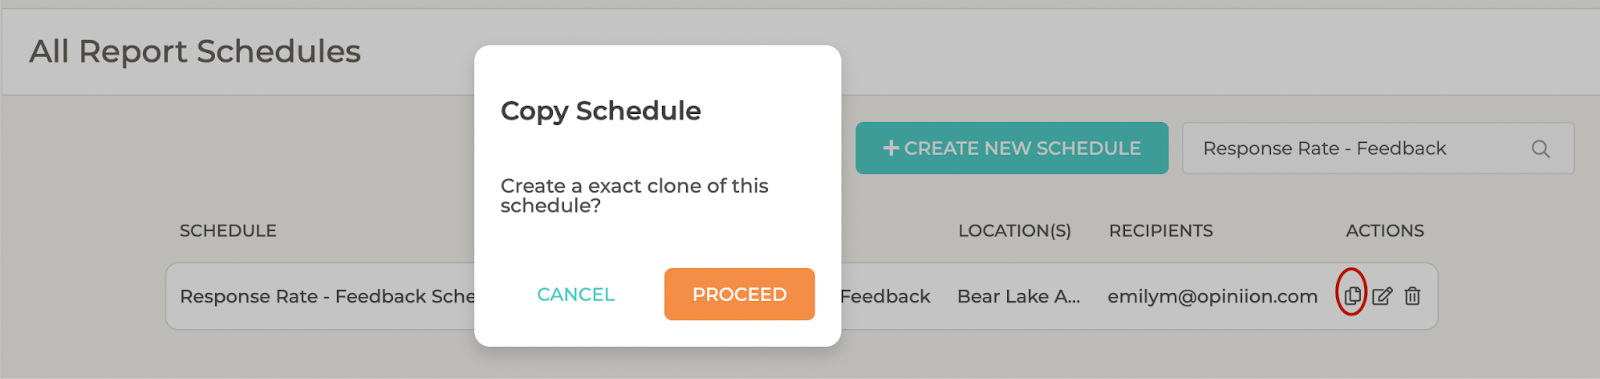
Users can also copy, edit, or delete any of the existing schedules by clicking on this icon.
Related Articles
Surveys Page
Surveys The Surveys page displays a list of all surveys that have been created. If the location is a property, we will also list Smart Surveys on this page. Each Smart Survey will have an icon to indicate that it cannot be edited or deleted. This is ...Accounts Page
About Accounts Get to know Accounts by watching this video, or reading below: An Account is the structured entity for your management company within Opiniion, which houses all of your company’s locations, users, groups, and more. To visit the ...Residents Page
The Residents Tab The Residents page is accessible to properties and enables users to view a list of all residents added to Opiniion. The table view provides a simple way to perform bulk actions by checking boxes, as well as filter, sort, or search ...Feedback Page
Welcome to the Opiniion feedback page! All feedback on this page is private and internal. It will not be visible to anyone except for you, your staff, or anyone having access to your location in Opiniion. All 1-5 feedback responses left by a Resident ...Campaigns Page
About Campaigns The Campaigns page allows users to manage interactions with multiple customers and residents via the different campaign types: Review Requests, Surveys, and Custom Messages. These campaigns can be set to run automatically (excluding ...